| 20-09-2015 06:40 |
DRKTS★★☆☆☆
(305) |
arthur18 wrote:
DKRTS and Surface Detail,
Don't worry guys, it's just a matter of time before people like myself and others who dare question bureaucracy will either be silenced or jailed and then you will have the world that you wished for and your children's children will be very happy as long as they accept everything they are told and never question anything. They will find out what's it like to live in today's China.
http://wattsupwiththat.com/2015/09/19/climate-science-turned-monster/
http://wattsupwiththat.com/2015/09/19/climate-alarmists-demand-obama-use-the-rico-act-to-silence-critics/
http://news.nationalpost.com/full-comment/rex-murphy-leap-manifesto-is-luthers-95-theses-for-the-climate-haunted
http://godfatherpolitics.com/14803/us-professor-lawrence-torcello-says-climate-change-skeptics-jailed/
http://www.quebecoislibre.org/08/080315-3.htm
http://pjmedia.com/tatler/2014/03/29/gawkers-adam-weinstein-wants-to-put-you-in-jail-for-being-a-climate-change-denier/
http://yellowhammernews.com/business-2/alabama-connection-rfk-jr-thinks-global-warming-skeptics-jailed/
http://www.climatedepot.com/2009/06/03/execute-skeptics-shock-call-to-action-at-what-point-do-we-jail-or-execute-global-warming-deniers-shouldnt-we-start-punishing-them-now/
The governments of the world will turn your children's children into mindless robots well before the climate does any harm to them.
Not a single reputable source there. All funded by fossil fuel companies to distribute disinformation. |
| 20-09-2015 08:41 |
MEJ☆☆☆☆☆
(1) |
seaninak wrote:
I'm a structural engineer. I make my living designing structures in the arctic. I have studied temperature data very closely because it factors into projections for ice formation, permafrost temperature and many other aspects of what I design.
Several years ago, I was gathering data for a site for the design of a bridge. Using the 50+ years of temperature data for Barrow, Alaska I generated a Freezing Index chart to determine the trends for use in our project. Just for entertainment, I fit a linear regression to the data to see if I could see "Global Warming" in the data. Sure enough, you could clearly see a decline in the Freezing Index over the 50 year period corresponding with a warming trend in the data. However, I also noticed that there was more of a curve to the chart than a linear representation captured. When a curve was fit to the data, it corresponded with a sinusoidal function with a period of approximately 80 years.
On a hunch, I did some looking at what solar cycles might be in that range. Interestingly, there is a solar cycle, the Glyssberg Cycle for solar irradiance/sunspot activity. Looking for some means of validating a hypothesis over such a long time frame, I searched for corresponding temperature and sunspot data that could be compared with each other to see if there is any relationship. I found the Central England Temperature Record (1659 to present) and a historical sunspot record over that same time period (give or take a few years). I plotted several moving averages of temperature vs sunspot count. Year to year, 11 year, 22 year...many others I got very little correlation. However, at 80 years the correlation is striking. I would invite any of you to duplicate what I've done and see it for yourself. The two records are very tightly correlated, and you can see the 80 year moving average of sunspot count is at the highest point ever recorded in the last 350 years. Is it just a coincidence that the temperature has risen and fallen with this moving average consistently during that time frame? See the attached chart and let me know what you think.
You have correlated data for Barrow Alaska with Central England and 'Glyssberg' cycle. It has no relevance to GLOBAL Warming vs GLOBAL Total
Solar Irradiance
Feulner & Rahmstorf 2010 show even a GRAND Solar Minimum will have a slight effect on Global temperatures.
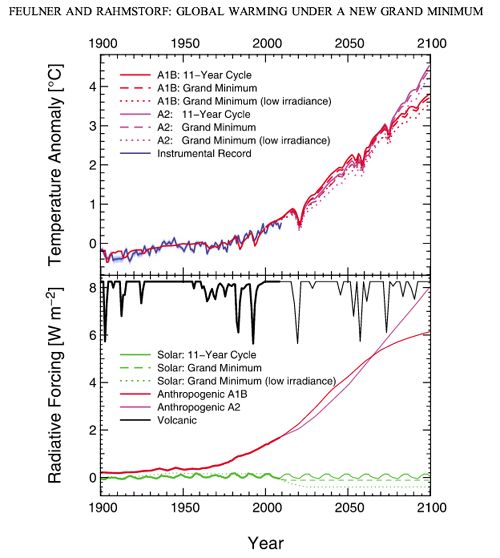
So you can see Total Solar Irradiance (TSI) has little forcing on GLOBAL Temperatures.
It is indeed a coincidence. |
| 20-09-2015 08:49 |
arthur18☆☆☆☆☆
(42) |
DKRTS wrote
"All funded by fossil fuel companies to distribute disinformation."
Are you a comedian? |
| 20-09-2015 18:55 |
DRKTS★★☆☆☆
(305) |
arthur18 wrote:
DKRTS wrote
"All funded by fossil fuel companies to distribute disinformation."
Are you a comedian?
No, but my wife thinks I have a great sense of humour! |
| 10-05-2020 17:11 |
Z06norway☆☆☆☆☆
(6) |
DRKTS wrote:
seaninak wrote:
I'm a structural engineer. I make my living designing structures in the arctic. I have studied temperature data very closely because it factors into projections for ice formation, permafrost temperature and many other aspects of what I design.
.....
On a hunch, I did some looking at what solar cycles might be in that range. Interestingly, there is a solar cycle, the Glyssberg Cycle for solar irradiance/sunspot activity. Looking for some means of validating a hypothesis over such a long time frame, I searched for corresponding temperature and sunspot data that could be compared with each other to see if there is any relationship. I found the Central England Temperature Record (1659 to present) and a historical sunspot record over that same time period (give or take a few years). I plotted several moving averages of temperature vs sunspot count. Year to year, 11 year, 22 year...many others I got very little correlation. However, at 80 years the correlation is striking. I would invite any of you to duplicate what I've done and see it for yourself. The two records are very tightly correlated, and you can see the 80 year moving average of sunspot count is at the highest point ever recorded in the last 350 years. Is it just a coincidence that the temperature has risen and fallen with this moving average consistently during that time frame? See the attached chart and let me know what you think.
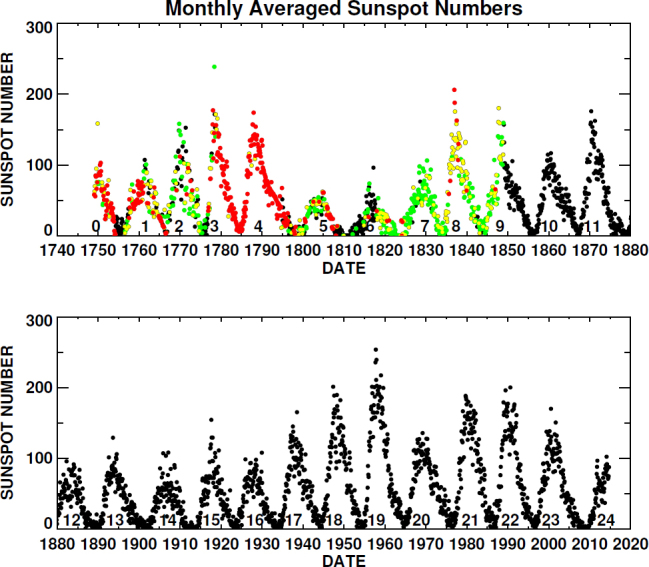
I don't know where you got the sunspot data from but it is completely wrong. The sunspot best data is from the Royal Belgian Observatory's Solar Influences Data Centre or from the NOAA Space Weather prediction center.
Your plot shows a peak in solar activity in about 2005, the actual peak was in 1957, since then there has been a steady decline in solar activity just as global temperatures started to rise rapidly.
PS almost no solar physicists take the Glyssberg Cycle seriously any more, myself included. I looked up sunspot data and cant find the 1957 peak, it seems sunspot Wass up all the way to 2005 ? This is directly from SIDC web page.... explain please.... http://sidc.oma.be/press/01/welcome.html |
|
| 10-05-2020 17:23 |
JackFou★☆☆☆☆
(114) |
If you look at the solar irradiance vs global temperature trends, you'll see that somewhere around the 1970s any semblance of correlation breaks down. Link
So whatever is driving up temperatures since then, it cannot be an increase in solar activity. |
| 10-05-2020 17:55 |
duncan61★★★★★
(2021) |
Nothing is driving the temperature up where and how please |
| 10-05-2020 18:49 |
IBdaMann ★★★★★ ★★★★★
(14414) |
JackFou wrote:So whatever is driving up temperatures since then, it cannot be an increase in solar activity.
What makes you believe anyone knows the average temperature of the earth to any usable margin of error?
Did tmiddles tell you that he knows? He's omniscient, by the way. Is that where you got the idea.
---
No actual scientist claims to be certain of trends without having seen valid datasets that conclude such through standard statistical methods. I notice you cited no data, no margin of error and no statistical methods. In science, the technical term for this is "pulling shit out of your ass."
This "shit" of course, is your religious dogma that you somehow expect to fool us into thinking is "thettled thienth.". I'll tell you what, I'll ask around and see if you fooled anyone.
.
I don't think i can [define it]. I just kind of get a feel for the phrase. - keepit
A Spaghetti strainer with the faucet running, retains water- tmiddles
Clouds don't trap heat. Clouds block cold. - Spongy Iris
Printing dollars to pay debt doesn't increase the number of dollars. - keepit
If Venus were a black body it would have a much much lower temperature than what we found there.- tmiddles
Ah the "Valid Data" myth of ITN/IBD. - tmiddles
Ceist - I couldn't agree with you more. But when money and religion are involved, and there are people who value them above all else, then the lies begin. - trafn
You are completely misunderstanding their use of the word "accumulation"! - Climate Scientist.
The Stefan-Boltzman equation doesn't come up with the correct temperature if greenhouse gases are not considered - Hank
:*sigh* Not the "raw data" crap. - Leafsdude
IB STILL hasn't explained what Planck's Law means. Just more hand waving that it applies to everything and more asserting that the greenhouse effect 'violates' it.- Ceist |
| 10-05-2020 19:00 |
JackFou★☆☆☆☆
(114) |
IBdaMann wrote:
JackFou wrote:So whatever is driving up temperatures since then, it cannot be an increase in solar activity.
What makes you believe anyone knows the average temperature of the earth to any usable margin of error?
The original author of the thread has done data analysis on their own measured data. If you want to debate the validity of that data, you'll have to take it up with them.
Regarding the data used by NASA, you can take it up with the people at the goddard space centre if you don't believe their analysis.
There is a lot of information available on their website, they even have a specific sub-website discussing uncertainties. |
| 10-05-2020 19:14 |
James___★★★★★
(5513) |
seaninak wrote:
I'm a structural engineer. I make my living designing structures in the arctic. I have studied temperature data very closely because it factors into projections for ice formation, permafrost temperature and many other aspects of what I design.
Several years ago, I was gathering data for a site for the design of a bridge. Using the 50+ years of temperature data for Barrow, Alaska I generated a Freezing Index chart to determine the trends for use in our project. Just for entertainment, I fit a linear regression to the data to see if I could see "Global Warming" in the data. Sure enough, you could clearly see a decline in the Freezing Index over the 50 year period corresponding with a warming trend in the data. However, I also noticed that there was more of a curve to the chart than a linear representation captured. When a curve was fit to the data, it corresponded with a sinusoidal function with a period of approximately 80 years.
On a hunch, I did some looking at what solar cycles might be in that range. Interestingly, there is a solar cycle, the Glyssberg Cycle for solar irradiance/sunspot activity. Looking for some means of validating a hypothesis over such a long time frame, I searched for corresponding temperature and sunspot data that could be compared with each other to see if there is any relationship. I found the Central England Temperature Record (1659 to present) and a historical sunspot record over that same time period (give or take a few years). I plotted several moving averages of temperature vs sunspot count. Year to year, 11 year, 22 year...many others I got very little correlation. However, at 80 years the correlation is striking. I would invite any of you to duplicate what I've done and see it for yourself. The two records are very tightly correlated, and you can see the 80 year moving average of sunspot count is at the highest point ever recorded in the last 350 years. Is it just a coincidence that the temperature has risen and fallen with this moving average consistently during that time frame? See the attached chart and let me know what you think.
It's well known that solar cycles have a 12 year period of activity.
This basically means that with things like solar flares, they have a trend that shows itself.
According to NASA, it's every 11 years or so.
Our Sun is a huge ball of electrically-charged hot gas. This charged gas moves, generating a powerful magnetic field. The Sun's magnetic field goes through a cycle, called the solar cycle.
Every 11 years or so, the Sun's magnetic field completely flips. This means that the Sun's north and south poles switch places. Then it takes about another 11 years for the Sun's north and south poles to flip back again.
https://spaceplace.nasa.gov/solar-cycles/en/
Edited on 10-05-2020 20:03 |
| 10-05-2020 22:55 |
IBdaMann★★★★★
(14414) |
James___ wrote:Our Sun is a huge ball of electrically-charged hot gas.
Might our sun be a big ball of plasma ... with the electrical charge being incidental to the stripping of the electrons due to the temperature?
.
I don't think i can [define it]. I just kind of get a feel for the phrase. - keepit
A Spaghetti strainer with the faucet running, retains water- tmiddles
Clouds don't trap heat. Clouds block cold. - Spongy Iris
Printing dollars to pay debt doesn't increase the number of dollars. - keepit
If Venus were a black body it would have a much much lower temperature than what we found there.- tmiddles
Ah the "Valid Data" myth of ITN/IBD. - tmiddles
Ceist - I couldn't agree with you more. But when money and religion are involved, and there are people who value them above all else, then the lies begin. - trafn
You are completely misunderstanding their use of the word "accumulation"! - Climate Scientist.
The Stefan-Boltzman equation doesn't come up with the correct temperature if greenhouse gases are not considered - Hank
:*sigh* Not the "raw data" crap. - Leafsdude
IB STILL hasn't explained what Planck's Law means. Just more hand waving that it applies to everything and more asserting that the greenhouse effect 'violates' it.- Ceist |
| 11-05-2020 00:04 |
Z06norway☆☆☆☆☆
(6) |
JackFou wrote:
If you look at the solar irradiance vs global temperature trends, you'll see that somewhere around the 1970s any semblance of correlation breaks down. Link
So whatever is driving up temperatures since then, it cannot be an increase in solar activity.
IF your data was correct, ? where is it from
Here is a link to a studie in Europe , shows clearly very good correlation with temp rise and fall, and rise again .
AND remember. its not only the SUNs absolute power or change in Energi output that control climate.... Clouds or how much clouds is a HUGE factor..... Can show you cloud coverage change 1983-2003, but after that mysteriously I cant find any.. https://iac.ethz.ch/group/climate-and-water-cycle/research/radiation-and-the-hydrological-cycle/global-dimming-and-brightening.html |
| 11-05-2020 00:08 |
Z06norway☆☆☆☆☆
(6) |
James___ wrote:
seaninak wrote:
I'm a structural engineer. I make my living designing structures in the arctic. I have studied temperature data very closely because it factors into projections for ice formation, permafrost temperature and many other aspects of what I design.
Several years ago, I was gathering data for a site for the design of a bridge. Using the 50+ years of temperature data for Barrow, Alaska I generated a Freezing Index chart to determine the trends for use in our project. Just for entertainment, I fit a linear regression to the data to see if I could see "Global Warming" in the data. Sure enough, you could clearly see a decline in the Freezing Index over the 50 year period corresponding with a warming trend in the data. However, I also noticed that there was more of a curve to the chart than a linear representation captured. When a curve was fit to the data, it corresponded with a sinusoidal function with a period of approximately 80 years.
On a hunch, I did some looking at what solar cycles might be in that range. Interestingly, there is a solar cycle, the Glyssberg Cycle for solar irradiance/sunspot activity. Looking for some means of validating a hypothesis over such a long time frame, I searched for corresponding temperature and sunspot data that could be compared with each other to see if there is any relationship. I found the Central England Temperature Record (1659 to present) and a historical sunspot record over that same time period (give or take a few years). I plotted several moving averages of temperature vs sunspot count. Year to year, 11 year, 22 year...many others I got very little correlation. However, at 80 years the correlation is striking. I would invite any of you to duplicate what I've done and see it for yourself. The two records are very tightly correlated, and you can see the 80 year moving average of sunspot count is at the highest point ever recorded in the last 350 years. Is it just a coincidence that the temperature has risen and fallen with this moving average consistently during that time frame? See the attached chart and let me know what you think.
It's well known that solar cycles have a 12 year period of activity.
This basically means that with things like solar flares, they have a trend that shows itself.
According to NASA, it's every 11 years or so.
Our Sun is a huge ball of electrically-charged hot gas. This charged gas moves, generating a powerful magnetic field. The Sun's magnetic field goes through a cycle, called the solar cycle.
Every 11 years or so, the Sun's magnetic field completely flips. This means that the Sun's north and south poles switch places. Then it takes about another 11 years for the Sun's north and south poles to flip back again.
https://spaceplace.nasa.gov/solar-cycles/en/
and a few other tidbits to complicate things, let me explain... through her..https://youtu.be/JyyuouPSNEA |
| 11-05-2020 00:12 |
JackFou★☆☆☆☆
(114) |
Z06norway wrote:
IF your data was correct, ? where is it from
It's not "my" data and the sources are named on the figure. For the temperature record, see gistemp. |
| 11-05-2020 00:52 |
Z06norway☆☆☆☆☆
(6) |
JackFou wrote:
Z06norway wrote:
IF your data was correct, ? where is it from
It's not "my" data and the sources are named on the figure. For the temperature record, see gistemp.
I was not referring to your presented temp graph, we all know what. NASA GISS did with historic data on temp
I mean your radiance chart is completely OFF what observed and measured ground energi from sun has been in Europe.
https://iac.ethz.ch/group/climate-and-water-cycle/research/radiation-and-the-hydrological-cycle/global-dimming-and-brightening.html |
|
| 11-05-2020 00:55 |
JackFou★☆☆☆☆
(114) |
Z06norway wrote:
JackFou wrote:
Z06norway wrote:
IF your data was correct, ? where is it from
It's not "my" data and the sources are named on the figure. For the temperature record, see gistemp.
I was not referring to your presented temp graph, we all know what. NASA GISS did with historic data on temp
I mean your radiance chart is completely OFF what observed and measured ground energi from sun has been in Europe.
https://iac.ethz.ch/group/climate-and-water-cycle/research/radiation-and-the-hydrological-cycle/global-dimming-and-brightening.html
The data source for the solar irradiance is also given in the figure. It's a combination of two datasets. PMOD from 1975-ish onwards and SATIRE for the time before 1975.
Edited on 11-05-2020 00:56 |
| 11-05-2020 01:00 |
Z06norway☆☆☆☆☆
(6) |
JackFou wrote:
Z06norway wrote:
JackFou wrote:
Z06norway wrote:
IF your data was correct, ? where is it from
It's not "my" data and the sources are named on the figure. For the temperature record, see gistemp.
I was not referring to your presented temp graph, we all know what. NASA GISS did with historic data on temp
I mean your radiance chart is completely OFF what observed and measured ground energi from sun has been in Europe.
https://iac.ethz.ch/group/climate-and-water-cycle/research/radiation-and-the-hydrological-cycle/global-dimming-and-brightening.html
The data source for the solar irradiance is also given in the figure. It's a combination of two datasets. PMOD from 1975-ish onwards and SATIRE for the time before 1975. . Yes NASA GISS know how to alter dataset, they use gross energi measured at outer space, energi that can vary 1358-1363 W/sqm. What drives temperature is energybalance received (ocean/land+ atmosphere) My link shows a measured observed energy in a time period... And correlates VERY well with dataset from 1900-2015. ORIGINAL dataset also lokk very different than NASA GISS modified version....https://phzoe.com/2019/12/30/what-global-warming/ |
| 11-05-2020 01:28 |
Into the Night ★★★★★ ★★★★★
(21599) |
JackFou wrote:
Z06norway wrote:
IF your data was correct, ? where is it from
It's not "my" data and the sources are named on the figure. For the temperature record, see gistemp.
NASA has no record of the temperature of the Earth. It is not possible to measure the temperature of the Earth. Mantra 25g...4b...37a...
No argument presented.
The Parrot Killer
Debunked in my sig. - tmiddles
Google keeps track of paranoid talk and i'm not on their list. I've been evaluated and certified. - keepit
nuclear powered ships do not require nuclear fuel. - Swan
While it is true that fossils do not burn it is also true that fossil fuels burn very well - Swan |
| 11-05-2020 01:30 |
Into the Night★★★★★
(21599) |
JackFou wrote:
Z06norway wrote:
JackFou wrote:
Z06norway wrote:
IF your data was correct, ? where is it from
It's not "my" data and the sources are named on the figure. For the temperature record, see gistemp.
I was not referring to your presented temp graph, we all know what. NASA GISS did with historic data on temp
I mean your radiance chart is completely OFF what observed and measured ground energi from sun has been in Europe.
https://iac.ethz.ch/group/climate-and-water-cycle/research/radiation-and-the-hydrological-cycle/global-dimming-and-brightening.html
The data source for the solar irradiance is also given in the figure. It's a combination of two datasets. PMOD from 1975-ish onwards and SATIRE for the time before 1975.
Electromagnetic energy is not thermal energy. Mantra 20g...29...
No argument presented. RQAA.
The Parrot Killer
Debunked in my sig. - tmiddles
Google keeps track of paranoid talk and i'm not on their list. I've been evaluated and certified. - keepit
nuclear powered ships do not require nuclear fuel. - Swan
While it is true that fossils do not burn it is also true that fossil fuels burn very well - Swan |
| 11-05-2020 01:39 |
JackFou★☆☆☆☆
(114) |
Into the Night wrote:
Electromagnetic energy is not thermal energy. Mantra 20g...29...
So how does thermal energy get from the sun to earth then? |
| 11-05-2020 02:10 |
James___★★★★★
(5513) |
IBdaMann wrote:
James___ wrote:Our Sun is a huge ball of electrically-charged hot gas.
Might our sun be a big ball of plasma ... with the electrical charge being incidental to the stripping of the electrons due to the temperature?
.
It's not the temperature, maybe. I explain at the end of the post. iter.org I think suggests that the magnetic field on the Sun is so intense that it strips the electrons. The heat is basically demonstrative of the work being done. Basically when an electron is stripped from a molecule, that molecule releases conserved electromagnetic radiation that we refer to as heat (a flow of electromagnetic radiation to be technical).
They use a toroidal coil to create a magnetic field that traps the heat. How iter.org generates heat is by using a laser that strips electrons from molecules. What they seem to miss is that if heat is not converted into electrons such as a solar panel does, then that could be why they have to run their system at dangerous temperatures so it will work. In that aspect, a hotter field will release more electrons. As to if you are right, that's still very much up to debate because they don't have the answer yet. If you consider how much hotter the Sun's corona is than it's surface, it's corona might be comparable to the toroidal field at ITER.
It's a good question because with ITER, billions of dollars are being spent to try and find that answer.
Edited on 11-05-2020 02:53 |
| 11-05-2020 02:17 |
James___★★★★★
(5513) |
Z06norway wrote:
James___ wrote:
seaninak wrote:
I'm a structural engineer. I make my living designing structures in the arctic. I have studied temperature data very closely because it factors into projections for ice formation, permafrost temperature and many other aspects of what I design.
Several years ago, I was gathering data for a site for the design of a bridge. Using the 50+ years of temperature data for Barrow, Alaska I generated a Freezing Index chart to determine the trends for use in our project. Just for entertainment, I fit a linear regression to the data to see if I could see "Global Warming" in the data. Sure enough, you could clearly see a decline in the Freezing Index over the 50 year period corresponding with a warming trend in the data. However, I also noticed that there was more of a curve to the chart than a linear representation captured. When a curve was fit to the data, it corresponded with a sinusoidal function with a period of approximately 80 years.
On a hunch, I did some looking at what solar cycles might be in that range. Interestingly, there is a solar cycle, the Glyssberg Cycle for solar irradiance/sunspot activity. Looking for some means of validating a hypothesis over such a long time frame, I searched for corresponding temperature and sunspot data that could be compared with each other to see if there is any relationship. I found the Central England Temperature Record (1659 to present) and a historical sunspot record over that same time period (give or take a few years). I plotted several moving averages of temperature vs sunspot count. Year to year, 11 year, 22 year...many others I got very little correlation. However, at 80 years the correlation is striking. I would invite any of you to duplicate what I've done and see it for yourself. The two records are very tightly correlated, and you can see the 80 year moving average of sunspot count is at the highest point ever recorded in the last 350 years. Is it just a coincidence that the temperature has risen and fallen with this moving average consistently during that time frame? See the attached chart and let me know what you think.
It's well known that solar cycles have a 12 year period of activity.
This basically means that with things like solar flares, they have a trend that shows itself.
According to NASA, it's every 11 years or so.
Our Sun is a huge ball of electrically-charged hot gas. This charged gas moves, generating a powerful magnetic field. The Sun's magnetic field goes through a cycle, called the solar cycle.
Every 11 years or so, the Sun's magnetic field completely flips. This means that the Sun's north and south poles switch places. Then it takes about another 11 years for the Sun's north and south poles to flip back again.
https://spaceplace.nasa.gov/solar-cycles/en/
and a few other tidbits to complicate things, let me explain... through her..https://youtu.be/JyyuouPSNEA
I actually have my own theory on this that I've been pursuing. Solar minimum and maximum IMO has to do with the solar constant. What has been demonstrated is that solar flares can cause a significant aurora borealis that if you live in Denver, Colorado, USA, it can be seen.
Something like that would fry all satellites unless they are protected from that much solar radiation. This tends to show that solar flares produce no lingering effects. I have checked solar activity and compared it to global temperatures and found it to be as random as CO2 levels.
What I find of interest is that if data is accurate, around 1980 things changed. This is basically what I'm on about. https://photos.app.goo.gl/E2aNFARUmcz6KLML9
And if you notice, ozone and not CO2 or water vapor absorbs much visible light.
I'm kind of big on O2, O and O3 depletion.
From science direct confirming that most solar radiation is in the visible wavelengths. https://www.sciencedirect.com/topics/engineering/spectral-irradiance
Edited on 11-05-2020 02:29 |
| 11-05-2020 03:49 |
James___★★★★★
(5513) |
JackFou wrote:
Into the Night wrote:
Electromagnetic energy is not thermal energy. Mantra 20g...29...
So how does thermal energy get from the sun to earth then?
It depends on whose calculations you use. If you consider the Stefan-Boltzmann constant and the inverse square principle, the Earth would be about 57 kelvins. I think it's the xenosphere that is responsible for the borealis. If you consider Senja, Norway, they have an observatory there and are on Facebook.
The borealis lights are caused by the solar wind interacting with the Earth's electromagnetic field. The solar particles are charged to about 8,000 volts each because of the Earth's atmosphere/magnetic field. When you learn about Norway, it helps you to understand our planet
If you want, we could do that math to consider w/m^2 in our atmosphere relative to 8,000 volts per solar particle. Then we'd know about how many particles are entering our atmosphere and how the Earth's magnetic field is focusing them.
This is because math is cool
p.s., I think this is GasGuzzler's favorite Facebook page as well. Thanks for the heads up GG. https://www.facebook.com/groups/1792618197423232/
Edited on 11-05-2020 03:55 |
| 11-05-2020 09:19 |
IBdaMann★★★★★
(14414) |
James___ wrote: If you consider the Stefan-Boltzmann constant and the inverse square principle, the Earth would be about 57 kelvins.
Yep, there's a very good reason the subjunctive is never allowed in science.
There is no "would" when it simply "is not."
You don't know the earth's emissivity. You do not know the earth's average global temperature to any usable accuracy. Having zero knowledge utterly undermines your credibility.
James___ wrote: If you consider Senja, Norway, they have an observatory there and are on Facebook.
... and they "friended" the Norwegian Jet Stream (who always "likes" their posts).
James___ wrote: When you learn about Norway, it helps you to understand our planet
Great point! Norway happens to be the exact center of the surface of the earth, specifically Trondheim, specifically the visitor's bench at the Tempebanen soccer field. That's why gravity fluctuates there and sometimes causes the ball to float away.
James___ wrote: 8,000 volts per solar particle.
James__, let's work on a way to capture these particles in Duracell batteries and then sell them for $25 each. I figure we could have a few $Billion in the first hour and we could retire.
.
I don't think i can [define it]. I just kind of get a feel for the phrase. - keepit
A Spaghetti strainer with the faucet running, retains water- tmiddles
Clouds don't trap heat. Clouds block cold. - Spongy Iris
Printing dollars to pay debt doesn't increase the number of dollars. - keepit
If Venus were a black body it would have a much much lower temperature than what we found there.- tmiddles
Ah the "Valid Data" myth of ITN/IBD. - tmiddles
Ceist - I couldn't agree with you more. But when money and religion are involved, and there are people who value them above all else, then the lies begin. - trafn
You are completely misunderstanding their use of the word "accumulation"! - Climate Scientist.
The Stefan-Boltzman equation doesn't come up with the correct temperature if greenhouse gases are not considered - Hank
:*sigh* Not the "raw data" crap. - Leafsdude
IB STILL hasn't explained what Planck's Law means. Just more hand waving that it applies to everything and more asserting that the greenhouse effect 'violates' it.- Ceist |
| 11-05-2020 10:21 |
Into the Night★★★★★
(21599) |
JackFou wrote:
Into the Night wrote:
Electromagnetic energy is not thermal energy. Mantra 20g...29...
So how does thermal energy get from the sun to earth then?
No argument presented. RQAA.
The Parrot Killer
Debunked in my sig. - tmiddles
Google keeps track of paranoid talk and i'm not on their list. I've been evaluated and certified. - keepit
nuclear powered ships do not require nuclear fuel. - Swan
While it is true that fossils do not burn it is also true that fossil fuels burn very well - Swan |
| 11-05-2020 14:20 |
JackFou★☆☆☆☆
(114) |
Into the Night wrote:
JackFou wrote:
Into the Night wrote:
Electromagnetic energy is not thermal energy. Mantra 20g...29...
So how does thermal energy get from the sun to earth then?
No argument presented. RQAA.
No answer presented. Try again. |
| 11-05-2020 16:10 |
IBdaMann★★★★★
(14414) |
JackFou wrote:
Into the Night wrote:
JackFou wrote:
Into the Night wrote:
Electromagnetic energy is not thermal energy. Mantra 20g...29...
So how does thermal energy get from the sun to earth then?
No argument presented. RQAA.
No answer presented. Try again.
If you want an answer to an inane question then you incur the responsibility to explain the relevance.
You might think the relelvance that you are imagining is obvious but you nonetheless need to explain; otherwise you have made argument to which to respond.
.
I don't think i can [define it]. I just kind of get a feel for the phrase. - keepit
A Spaghetti strainer with the faucet running, retains water- tmiddles
Clouds don't trap heat. Clouds block cold. - Spongy Iris
Printing dollars to pay debt doesn't increase the number of dollars. - keepit
If Venus were a black body it would have a much much lower temperature than what we found there.- tmiddles
Ah the "Valid Data" myth of ITN/IBD. - tmiddles
Ceist - I couldn't agree with you more. But when money and religion are involved, and there are people who value them above all else, then the lies begin. - trafn
You are completely misunderstanding their use of the word "accumulation"! - Climate Scientist.
The Stefan-Boltzman equation doesn't come up with the correct temperature if greenhouse gases are not considered - Hank
:*sigh* Not the "raw data" crap. - Leafsdude
IB STILL hasn't explained what Planck's Law means. Just more hand waving that it applies to everything and more asserting that the greenhouse effect 'violates' it.- Ceist |
| 11-05-2020 16:35 |
DRKTS★★☆☆☆
(305) |
Z06norway wrote:
DRKTS wrote:
seaninak wrote:
I'm a structural engineer. I make my living designing structures in the arctic. I have studied temperature data very closely because it factors into projections for ice formation, permafrost temperature and many other aspects of what I design.
.....
On a hunch, I did some looking at what solar cycles might be in that range. Interestingly, there is a solar cycle, the Glyssberg Cycle for solar irradiance/sunspot activity. Looking for some means of validating a hypothesis over such a long time frame, I searched for corresponding temperature and sunspot data that could be compared with each other to see if there is any relationship. I found the Central England Temperature Record (1659 to present) and a historical sunspot record over that same time period (give or take a few years). I plotted several moving averages of temperature vs sunspot count. Year to year, 11 year, 22 year...many others I got very little correlation. However, at 80 years the correlation is striking. I would invite any of you to duplicate what I've done and see it for yourself. The two records are very tightly correlated, and you can see the 80 year moving average of sunspot count is at the highest point ever recorded in the last 350 years. Is it just a coincidence that the temperature has risen and fallen with this moving average consistently during that time frame? See the attached chart and let me know what you think.
I don't know where you got the sunspot data from but it is completely wrong. The sunspot best data is from the Royal Belgian Observatory's Solar Influences Data Centre or from the NOAA Space Weather prediction center.
Your plot shows a peak in solar activity in about 2005, the actual peak was in 1957, since then there has been a steady decline in solar activity just as global temperatures started to rise rapidly.
PS almost no solar physicists take the Glyssberg Cycle seriously any more, myself included. I looked up sunspot data and cant find the 1957 peak, it seems sunspot Wass up all the way to 2005 ? This is directly from SIDC web page.... explain please.... http://sidc.oma.be/press/01/welcome.html |
| 11-05-2020 16:46 |
DRKTS★★☆☆☆
(305) |
Z06norway wrote:
DRKTS wrote:
seaninak wrote:
I'm a structural engineer. I make my living designing structures in the arctic. I have studied temperature data very closely because it factors into projections for ice formation, permafrost temperature and many other aspects of what I design.
.....
On a hunch, I did some looking at what solar cycles might be in that range. Interestingly, there is a solar cycle, the Glyssberg Cycle for solar irradiance/sunspot activity. Looking for some means of validating a hypothesis over such a long time frame, I searched for corresponding temperature and sunspot data that could be compared with each other to see if there is any relationship. I found the Central England Temperature Record (1659 to present) and a historical sunspot record over that same time period (give or take a few years). I plotted several moving averages of temperature vs sunspot count. Year to year, 11 year, 22 year...many others I got very little correlation. However, at 80 years the correlation is striking. I would invite any of you to duplicate what I've done and see it for yourself. The two records are very tightly correlated, and you can see the 80 year moving average of sunspot count is at the highest point ever recorded in the last 350 years. Is it just a coincidence that the temperature has risen and fallen with this moving average consistently during that time frame? See the attached chart and let me know what you think.
I don't know where you got the sunspot data from but it is completely wrong. The sunspot best data is from the Royal Belgian Observatory's Solar Influences Data Centre or from the NOAA Space Weather prediction center.
Your plot shows a peak in solar activity in about 2005, the actual peak was in 1957, since then there has been a steady decline in solar activity just as global temperatures started to rise rapidly.
PS almost no solar physicists take the Glyssberg Cycle seriously any more, myself included. I looked up sunspot data and cant find the 1957 peak, it seems sunspot Wass up all the way to 2005 ? This is directly from SIDC web page.... explain please.... http://sidc.oma.be/press/01/welcome.html
You cannot see that the largest solar cycle on record is in 1957? Really? All of the figures in the article you quoted show it.
2005 is 3 years year after the peak of solar cycle 23 which itself was a medium intensity cycle (9th largest)
Look at the SIDC data: http://sidc.oma.be/silso/monthlyssnplot |
| 11-05-2020 19:18 |
Z06norway☆☆☆☆☆
(6) |
DRKTS wrote:
Z06norway wrote:
DRKTS wrote:
seaninak wrote:
I'm a structural engineer. I make my living designing structures in the arctic. I have studied temperature data very closely because it factors into projections for ice formation, permafrost temperature and many other aspects of what I design.
.....
On a hunch, I did some looking at what solar cycles might be in that range. Interestingly, there is a solar cycle, the Glyssberg Cycle for solar irradiance/sunspot activity. Looking for some means of validating a hypothesis over such a long time frame, I searched for corresponding temperature and sunspot data that could be compared with each other to see if there is any relationship. I found the Central England Temperature Record (1659 to present) and a historical sunspot record over that same time period (give or take a few years). I plotted several moving averages of temperature vs sunspot count. Year to year, 11 year, 22 year...many others I got very little correlation. However, at 80 years the correlation is striking. I would invite any of you to duplicate what I've done and see it for yourself. The two records are very tightly correlated, and you can see the 80 year moving average of sunspot count is at the highest point ever recorded in the last 350 years. Is it just a coincidence that the temperature has risen and fallen with this moving average consistently during that time frame? See the attached chart and let me know what you think.
I don't know where you got the sunspot data from but it is completely wrong. The sunspot best data is from the Royal Belgian Observatory's Solar Influences Data Centre or from the NOAA Space Weather prediction center.
Your plot shows a peak in solar activity in about 2005, the actual peak was in 1957, since then there has been a steady decline in solar activity just as global temperatures started to rise rapidly.
PS almost no solar physicists take the Glyssberg Cycle seriously any more, myself included. I looked up sunspot data and cant find the 1957 peak, it seems sunspot Wass up all the way to 2005 ? This is directly from SIDC web page.... explain please.... http://sidc.oma.be/press/01/welcome.html
You cannot see that the largest solar cycle on record is in 1957? Really? All of the figures in the article you quoted show it.
2005 is 3 years year after the peak of solar cycle 23 which itself was a medium intensity cycle (9th largest)
Look at the SIDC data: http://sidc.oma.be/silso/monthlyssnplot
sorry my bad, sun cycle 19 was highest, then a sharp drop in 20 and almost same level for 21, 22 and 23 and there is more to energi from sun than # of sunspots. The polarisation and intensity is not expressed in # sunspots ? So you can not use that factor alone to dismiss energy balance from the sun.... Energy from sun peaked around 2000 https://youtu.be/JyyuouPSNEA |
|
| 11-05-2020 19:30 |
James___★★★★★
(5513) |
Z06norway wrote:
DRKTS wrote:
Z06norway wrote:
DRKTS wrote:
seaninak wrote:
I'm a structural engineer. I make my living designing structures in the arctic. I have studied temperature data very closely because it factors into projections for ice formation, permafrost temperature and many other aspects of what I design.
.....
On a hunch, I did some looking at what solar cycles might be in that range. Interestingly, there is a solar cycle, the Glyssberg Cycle for solar irradiance/sunspot activity. Looking for some means of validating a hypothesis over such a long time frame, I searched for corresponding temperature and sunspot data that could be compared with each other to see if there is any relationship. I found the Central England Temperature Record (1659 to present) and a historical sunspot record over that same time period (give or take a few years). I plotted several moving averages of temperature vs sunspot count. Year to year, 11 year, 22 year...many others I got very little correlation. However, at 80 years the correlation is striking. I would invite any of you to duplicate what I've done and see it for yourself. The two records are very tightly correlated, and you can see the 80 year moving average of sunspot count is at the highest point ever recorded in the last 350 years. Is it just a coincidence that the temperature has risen and fallen with this moving average consistently during that time frame? See the attached chart and let me know what you think.
I don't know where you got the sunspot data from but it is completely wrong. The sunspot best data is from the Royal Belgian Observatory's Solar Influences Data Centre or from the NOAA Space Weather prediction center.
Your plot shows a peak in solar activity in about 2005, the actual peak was in 1957, since then there has been a steady decline in solar activity just as global temperatures started to rise rapidly.
PS almost no solar physicists take the Glyssberg Cycle seriously any more, myself included. I looked up sunspot data and cant find the 1957 peak, it seems sunspot Wass up all the way to 2005 ? This is directly from SIDC web page.... explain please.... http://sidc.oma.be/press/01/welcome.html
You cannot see that the largest solar cycle on record is in 1957? Really? All of the figures in the article you quoted show it.
2005 is 3 years year after the peak of solar cycle 23 which itself was a medium intensity cycle (9th largest)
Look at the SIDC data: http://sidc.oma.be/silso/monthlyssnplot
sorry my bad, sun cycle 19 was highest, then a sharp drop in 20 and almost same level for 21, 22 and 23 and there is more to energi from sun than # of sunspots. The polarisation and intensity is not expressed in # sunspots ? So you can not use that factor alone to dismiss energy balance from the sun.... Energy from sun peaked around 2000 https://youtu.be/JyyuouPSNEA
This shows no relationship to global temperatures. Sun spot activity peaked when there was no warming. Going back to 1776, the Delaware River was frozen over when Gen. Washington crossed it. 1940 was also warmer than 1950 to 1960.
And from 1945 to 1975, temperatures really didn't very much, it looks like within = or - 1.5º C. And yet sun spots peaked during those years. it looks like from 1940, it took until 1985 for things to get warmer.
I'll leave you to your discussion.
https://www.ncbi.nlm.nih.gov/pmc/articles/PMC4841188/
Attached image:
Edited on 11-05-2020 19:39 |
| 11-05-2020 19:50 |
JackFou★☆☆☆☆
(114) |
IBdaMann wrote:
JackFou wrote:
Into the Night wrote:
JackFou wrote:
Into the Night wrote:
Electromagnetic energy is not thermal energy. Mantra 20g...29...
So how does thermal energy get from the sun to earth then?
No argument presented. RQAA.
No answer presented. Try again.
If you want an answer to an inane question then you incur the responsibility to explain the relevance.
You might think the relelvance that you are imagining is obvious but you nonetheless need to explain; otherwise you have made argument to which to respond.
I'm surprised that you haven't collapsed to form a black hole, being as dense as you are.
It's very simple, really. As you are well aware, I claim that radiative energy transfer happens in the following manner: Object A emits a photon, the photon travels through space until it hits object B, object B absorbs the photon and converts it to thermal energy.
Both you and ITN have repeatedly dismissed this, claiming that electromagnetic energy isn't thermal energy.
Therefore, one of two conclusions must be true:
a) radiative energy transfer happens by other means
b) radiative energy transfer is impossible
I hope you'll agree with me that option b is nonsense. So by elimination you must therefore believe option b is true.
If option b is true, then how does thermal energy get from the sun to the earth? |
| 11-05-2020 21:03 |
JackFou★☆☆☆☆
(114) |
JackFou wrote:
Therefore, one of two conclusions must be true:
a) radiative energy transfer happens by other means
b) radiative energy transfer is impossible
I hope you'll agree with me that option b is nonsense. So by elimination you must therefore believe option b is true.
If option b is true, then how does thermal energy get from the sun to the earth?
That last bit was obviously a typo. It should have read:
So by elimination you must therefore believe option a is true.
If option a is true, then how does thermal energy get from the sun to the earth? |
| 11-05-2020 21:17 |
James___★★★★★
(5513) |
JackFou wrote:
JackFou wrote:
Therefore, one of two conclusions must be true:
a) radiative energy transfer happens by other means
b) radiative energy transfer is impossible
I hope you'll agree with me that option b is nonsense. So by elimination you must therefore believe option b is true.
If option b is true, then how does thermal energy get from the sun to the earth?
That last bit was obviously a typo. It should have read:
So by elimination you must therefore believe option a is true.
If option a is true, then how does thermal energy get from the sun to the earth?
I think with option b you were asking if it is impossible, then how does the Sun heat the Earth? Of course when you are dealing with a binary (itn and ibdm) black hole system....
With me, I wonder if the Sun's corona is emitting the energy while the surface of the Sun might be absorbing energy. Think about the event horizon on a black hole. Same principle but smaller scale so it lacks the gravity necessary to prevent the solar wind from occurring. |
| 12-05-2020 00:43 |
Into the Night★★★★★
(21599) |
JackFou wrote:
Into the Night wrote:
JackFou wrote:
Into the Night wrote:
Electromagnetic energy is not thermal energy. Mantra 20g...29...
So how does thermal energy get from the sun to earth then?
No argument presented. RQAA.
No answer presented. Try again.
Lie. RQAA.
The Parrot Killer
Debunked in my sig. - tmiddles
Google keeps track of paranoid talk and i'm not on their list. I've been evaluated and certified. - keepit
nuclear powered ships do not require nuclear fuel. - Swan
While it is true that fossils do not burn it is also true that fossil fuels burn very well - Swan |
| 12-05-2020 00:50 |
Into the Night★★★★★
(21599) |
JackFou wrote:
I'm surprised that you haven't collapsed to form a black hole, being as dense as you are.
Mantra 1...(although an entertaining one ).
JackFou wrote:
It's very simple, really. As you are well aware, I claim that radiative energy transfer happens in the following manner: Object A emits a photon, the photon travels through space until it hits object B, object B absorbs the photon and converts it to thermal energy.
Absorption does not create energy. Mantra 20a1.
JackFou wrote:
Both you and ITN have repeatedly dismissed this,
Lie. Neither of us has dismissed absorption (conversion of light into chemical energy, ionization, or thermal energy).
JackFou wrote:
claiming that electromagnetic energy isn't thermal energy.
It isn't. Mantra 20g.
JackFou wrote:
Therefore, one of two conclusions must be true:
a) radiative energy transfer happens by other means
b) radiative energy transfer is impossible
I hope you'll agree with me that option b is nonsense. So by elimination you must therefore believe option b is true.
False dichotomy fallacy.
JackFou wrote:
If option b is true, then how does thermal energy get from the sun to the earth?
False dichotomy fallacy. Loaded question. Mantra 29.
The Parrot Killer
Debunked in my sig. - tmiddles
Google keeps track of paranoid talk and i'm not on their list. I've been evaluated and certified. - keepit
nuclear powered ships do not require nuclear fuel. - Swan
While it is true that fossils do not burn it is also true that fossil fuels burn very well - Swan |
| 12-05-2020 00:51 |
Into the Night★★★★★
(21599) |
JackFou wrote:
JackFou wrote:
Therefore, one of two conclusions must be true:
a) radiative energy transfer happens by other means
b) radiative energy transfer is impossible
I hope you'll agree with me that option b is nonsense. So by elimination you must therefore believe option b is true.
If option b is true, then how does thermal energy get from the sun to the earth?
That last bit was obviously a typo. It should have read:
So by elimination you must therefore believe option a is true.
If option a is true, then how does thermal energy get from the sun to the earth?
Loaded question. Mantra 29.
The Parrot Killer
Debunked in my sig. - tmiddles
Google keeps track of paranoid talk and i'm not on their list. I've been evaluated and certified. - keepit
nuclear powered ships do not require nuclear fuel. - Swan
While it is true that fossils do not burn it is also true that fossil fuels burn very well - Swan |
| 12-05-2020 01:22 |
JackFou★☆☆☆☆
(114) |
Into the Night wrote:
JackFou wrote:
JackFou wrote:
Therefore, one of two conclusions must be true:
a) radiative energy transfer happens by other means
b) radiative energy transfer is impossible
I hope you'll agree with me that option b is nonsense. So by elimination you must therefore believe option b is true.
If option b is true, then how does thermal energy get from the sun to the earth?
That last bit was obviously a typo. It should have read:
So by elimination you must therefore believe option a is true.
If option a is true, then how does thermal energy get from the sun to the earth?
Loaded question. Mantra 29.
Still waiting for your answer on how the sun warms the earth through space without making use of photons. |
| 12-05-2020 02:01 |
IBdaMann★★★★★
(14414) |
JackFou wrote: As you are well aware, I claim that radiative energy transfer
Hey moron, there is no such thing as radiative energy transfer. Weren't you supposed to at least attempt to read something other than Wikipedia so as to earn the opportunity to chime in a couple of peanuts. Radiance is an electromagnetic emission. Thermal energy is what is transferred between bodies you moron because thermal energy only exists in matter while electromagnetic energy does not reside within matter and therefore does not transfer from one body to another.
I won't explain this to you again.
JackFou wrote: ... happens in the following manner: Object A emits a photon, the photon travels through space ...
[blah, blah, blah ... irrelevant blather on elecrtomagnetic energy deleted]
JackFou wrote: ... object B absorbs the photon and converts it to thermal energy.
Do you believe this happens with all photons whenever one becomes incident with a body?
JackFou wrote: Both you and ITN have repeatedly dismissed this,
Incorrect, Mr. Zero-Reading-Comprehension. Neither he nor I have denied electromagnetic physics any more than we have denied that flouride has a chemical effect on tooth enamel, but that isn't relevant to this discussion either. You insist on discussing electromagnetic energy while we are trying to discuss thermal energy, as though you don't understand that they are competely separate topics. Hence, every time you snap right back to discussing electromagnetic energy, we roll our eyes, face palm and summarily ignore what you are writing. The same would happen if you were to drift into discussing fluoroapatite; it's something other than thermal energy and is irrelevant to this discussion.
JackFou wrote: ... then how does thermal energy get from the sun to the earth?
Maybe this will help you: suppose hypothetically that I were to respond "I don't know and I don't care. It is sufficient that I acknowledge that it does." Now are you able to free yourself from your distractions and focus on the thermal energy?
Are you able to fill a gas tank with fuel? Is it not sufficient to understand that the gasoline is being transferred into your tank without having to understand the fluid dynamics within the hose of the gas pump into which you cannot see or measure? Can you not simply measure the quantity of fuel in the tank to verify the flow of fuel into the tank?
... or can you really not fill a gas tank?
.
I don't think i can [define it]. I just kind of get a feel for the phrase. - keepit
A Spaghetti strainer with the faucet running, retains water- tmiddles
Clouds don't trap heat. Clouds block cold. - Spongy Iris
Printing dollars to pay debt doesn't increase the number of dollars. - keepit
If Venus were a black body it would have a much much lower temperature than what we found there.- tmiddles
Ah the "Valid Data" myth of ITN/IBD. - tmiddles
Ceist - I couldn't agree with you more. But when money and religion are involved, and there are people who value them above all else, then the lies begin. - trafn
You are completely misunderstanding their use of the word "accumulation"! - Climate Scientist.
The Stefan-Boltzman equation doesn't come up with the correct temperature if greenhouse gases are not considered - Hank
:*sigh* Not the "raw data" crap. - Leafsdude
IB STILL hasn't explained what Planck's Law means. Just more hand waving that it applies to everything and more asserting that the greenhouse effect 'violates' it.- Ceist |
| 12-05-2020 12:18 |
Into the Night★★★★★
(21599) |
JackFou wrote:
Into the Night wrote:
JackFou wrote:
JackFou wrote:
Therefore, one of two conclusions must be true:
a) radiative energy transfer happens by other means
b) radiative energy transfer is impossible
I hope you'll agree with me that option b is nonsense. So by elimination you must therefore believe option b is true.
If option b is true, then how does thermal energy get from the sun to the earth?
That last bit was obviously a typo. It should have read:
So by elimination you must therefore believe option a is true.
If option a is true, then how does thermal energy get from the sun to the earth?
Loaded question. Mantra 29.
Still waiting for your answer on how the sun warms the earth through space without making use of photons.
RQAA
The Parrot Killer
Debunked in my sig. - tmiddles
Google keeps track of paranoid talk and i'm not on their list. I've been evaluated and certified. - keepit
nuclear powered ships do not require nuclear fuel. - Swan
While it is true that fossils do not burn it is also true that fossil fuels burn very well - Swan |