Appendix B - Calculating The Economic Costs of Extreme Weather Events
By Kasper Sulkjær Andersen
This article is a part of a master's thesis from 2013.
APPENDIX B - CALCULATING THE ECONOMIC COSTS OF EXTREME WEATHER EVENTS
The calculation of the economic costs of natural disasters (cyclones, droughts, and floods) in China followed these consecutive stages:
1) Obtaining data: Initially, as the aim is to calculate the ratio between aggregated damage costs and China’s Gross Domestic Product (GDP), data on both variables needed to be obtained. EM-DAT provides data195 on all global occurrences of disasters196. Importantly, from the perspective of the present dissertation EM-DAT provides estimates of damage costs of individual disasters measured in current US$. These damage estimates together with other relevant signifiers are provided in all datasets downloaded from EM-DAT.
Data on China’s GDP in the period from 1990-2009 was downloaded using the World Bank’s World Development Indicators197. GDP was measured in constant 2000US$.
2) Sorting data: The data provided by EM-DAT can be considered raw data as the downloaded dataset contains a lot of irrelevant information from the perspective of the present dissertation. The first stage is then to select the types of natural disasters with direct relevance to the present study. Since we are only interested in the occurrence of droughts, floods and tropical cyclones all other occurrences of natural disasters can be eliminated.
3) Aggregating annual damage costs: Since estimated damage costs from EM-DAT are measured in current US$ the first step is to aggregate annual damage costs incurred as a result of each individual disaster type; i.e. SUM(costdrought + costcyclone + costflood)t. This is a vital step due to the fact that estimates measured in current US$ cannot be aggregated across more than one year due to the distorting effect of inflation. In other words, due to volatile prices it would be inaccurate to compare damage costs measured in 1990US$ to damage costs measured in 1995US$. To facilitate comparison across a given time period current US$ need to be converted into constant US$ in order to eliminate the effect of inflation.
4) Converting annual damage costs: After having aggregated damage costs on a yearly basis in the period from 1990-2009 it is necessary to convert each annual damage estimate into 2000 constant US$198 by utilising the following formula:
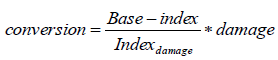
For instance, in order to convert the damage costs in 1990 current US$ to 2000 constant US$ the price index199 for 2000 (base-index) needs to be divided by the 1990 price index (indexdamage) and the fraction multiplied by the 1990 damage estimate. This calculation is repeated for each year in the time period.
5) Aggregating damage costs: In this step the annual damage estimates, now in constant 2000 US$, need to be aggregated. For the sake of comparison, I aggregated the annual estimates across the following time periods: 1) 1990-1999, 2) 2000-2009 and 3) 1990-2009.
6) Aggregating GDP: Since the estimates of China’s GDP, obtained from the World Bank, are already measured in constant 2000 US$ conversion is unnecessary. For this reason, China’s GDP in the time period from 1990-2009 can be straightforwardly aggregated by summarising each annual GDP measure according to the same three time periods used in stage 5 (i.e. 1) 1990-1999, 2) 2000-2009, 3) 1990-2009)).
7) Computing relative values: In this stage, the aggregated damage estimates of extreme weather events need to be converted into relative values (i.e. a fraction of total Chinese GDP in constant 2000 US$). For instance, for the time period 1990-1999, total damage costs incurred by China in this period was divided by total Chinese GDP in the same period. The result was then multiplied by a factor 100 so as to produce a percentage value.
8) Correcting the calculations: As noted in the dissertation not all extreme weather events are directly caused by climate change. It is estimated that roughly 65 percent of all damage costs are associated directly by changing climatic conditions. In order to take this into consideration when computing the cost estimates, the aggregated annual costs from stage 5 are multiplied by 0.65 representing 65 percent of total damage costs. The same steps outlined in stage 6 and 7 are then repeated to produce the corrected relative values.
This article is a part of a master's thesis from 2013.
| < Appendix A | Table of Contents | Appendix C > |
APPENDIX B - CALCULATING THE ECONOMIC COSTS OF EXTREME WEATHER EVENTS
The calculation of the economic costs of natural disasters (cyclones, droughts, and floods) in China followed these consecutive stages:
1) Obtaining data: Initially, as the aim is to calculate the ratio between aggregated damage costs and China’s Gross Domestic Product (GDP), data on both variables needed to be obtained. EM-DAT provides data195 on all global occurrences of disasters196. Importantly, from the perspective of the present dissertation EM-DAT provides estimates of damage costs of individual disasters measured in current US$. These damage estimates together with other relevant signifiers are provided in all datasets downloaded from EM-DAT.
Data on China’s GDP in the period from 1990-2009 was downloaded using the World Bank’s World Development Indicators197. GDP was measured in constant 2000US$.
2) Sorting data: The data provided by EM-DAT can be considered raw data as the downloaded dataset contains a lot of irrelevant information from the perspective of the present dissertation. The first stage is then to select the types of natural disasters with direct relevance to the present study. Since we are only interested in the occurrence of droughts, floods and tropical cyclones all other occurrences of natural disasters can be eliminated.
3) Aggregating annual damage costs: Since estimated damage costs from EM-DAT are measured in current US$ the first step is to aggregate annual damage costs incurred as a result of each individual disaster type; i.e. SUM(costdrought + costcyclone + costflood)t. This is a vital step due to the fact that estimates measured in current US$ cannot be aggregated across more than one year due to the distorting effect of inflation. In other words, due to volatile prices it would be inaccurate to compare damage costs measured in 1990US$ to damage costs measured in 1995US$. To facilitate comparison across a given time period current US$ need to be converted into constant US$ in order to eliminate the effect of inflation.
4) Converting annual damage costs: After having aggregated damage costs on a yearly basis in the period from 1990-2009 it is necessary to convert each annual damage estimate into 2000 constant US$198 by utilising the following formula:
For instance, in order to convert the damage costs in 1990 current US$ to 2000 constant US$ the price index199 for 2000 (base-index) needs to be divided by the 1990 price index (indexdamage) and the fraction multiplied by the 1990 damage estimate. This calculation is repeated for each year in the time period.
5) Aggregating damage costs: In this step the annual damage estimates, now in constant 2000 US$, need to be aggregated. For the sake of comparison, I aggregated the annual estimates across the following time periods: 1) 1990-1999, 2) 2000-2009 and 3) 1990-2009.
6) Aggregating GDP: Since the estimates of China’s GDP, obtained from the World Bank, are already measured in constant 2000 US$ conversion is unnecessary. For this reason, China’s GDP in the time period from 1990-2009 can be straightforwardly aggregated by summarising each annual GDP measure according to the same three time periods used in stage 5 (i.e. 1) 1990-1999, 2) 2000-2009, 3) 1990-2009)).
7) Computing relative values: In this stage, the aggregated damage estimates of extreme weather events need to be converted into relative values (i.e. a fraction of total Chinese GDP in constant 2000 US$). For instance, for the time period 1990-1999, total damage costs incurred by China in this period was divided by total Chinese GDP in the same period. The result was then multiplied by a factor 100 so as to produce a percentage value.
8) Correcting the calculations: As noted in the dissertation not all extreme weather events are directly caused by climate change. It is estimated that roughly 65 percent of all damage costs are associated directly by changing climatic conditions. In order to take this into consideration when computing the cost estimates, the aggregated annual costs from stage 5 are multiplied by 0.65 representing 65 percent of total damage costs. The same steps outlined in stage 6 and 7 are then repeated to produce the corrected relative values.
| < Appendix A | Table of Contents | Appendix C > |
Posted by branner
on 24. May 2014, 17:11 0 comment(s) · 2341 views
Comments
No comments yet.
Join the debate on Appendix B - Calculating The Economic Costs of Extreme Weather Events:
Related content
| Articles |
| Appendix D - Interview-guide |
| Appendix C - China's Environmental Crisis |
| Appendix A - Tracing China's Climate Policy |
| Threads | Replies | Last post |
| weather | 27 | 27-02-2024 22:55 |
| Offshore wind projects face economic storm. Cancellations jeopardize Biden clean energy goals | 7 | 05-11-2023 20:41 |
| White House ridiculed for defending Biden's economic record as 'incredibly popular:' 'Wit | 0 | 28-06-2023 12:33 |
| The Weather, Climate Change Are Revealing The Truth Of This Corrupt Society System | 50 | 10-01-2023 16:48 |
| economic output emissions intensity vs global emissions / global GDP | 92 | 20-11-2022 23:16 |