Climate Change is a Blessing.
| Climate Change is a Blessing.13-04-2017 19:49 | |
| PitonObserver☆☆☆☆☆ (5) |
Read this first. https://www.facebook.com/notes/amatus-edwards/climate-change-is-a-blessing/1704972519821336 Edited on 13-04-2017 19:56 |
| 13-04-2017 20:19 | |
| Tim the plumber★★★★☆ (1356) |
Don't bother it's drivel.
Edited on 13-04-2017 20:19 |
| 13-04-2017 20:34 | |
| PitonObserver☆☆☆☆☆ (5) |
Tim the plumber wrote: I see that the content has challenged you sense of civility. What about the article that constitutes drivel? |
| 14-04-2017 01:27 | |
| Wake★★★★★ (4034) |
PitonObserver wrote:Tim the plumber wrote: The only "warming" that we've experienced beyond the normal recovery from the Little Ice Age (The Maunder Minimum) is the normal cyclic warming and cooling spells that constitutes "weather". A great deal of the "data" has been purposely misrepresented. Such as the NOAA temperature tables. They were pressured by the Obama administration to supply proof positive of AGW so that he could give a speech before the IPCC and so they simply made too small a correction for the urban heating coefficient. Since most of the temperature sites were in rapidly growing urban areas the temperatures went off of the charts instead of showing what surrounding rural areas showed - no change. |
| 14-04-2017 03:03 | |
| GasGuzzler★★★★★ (2935) |
Wake wrote Wake, I was surfing around one evening and found this incredible site where you could go anywhere in the world and see ~100 year temperature records....all from rural reporting stations. There was not a hockey stick to be found. You could also compare the same temp record against the nearest urban reporting station and clearly see the difference. Dumbass ADD me, I got distracted and forgot to save the link. Do you happen to know what I'm talking about or have that site? Thanks |
| 14-04-2017 03:46 | |
Into the Night ★★★★★ ★★★★★(21599) |
GasGuzzler wrote:Wake wrote Don't know about a world site that does that. It would surprise me, since most station records in Europe were destroyed in the wars. There is a site that shows the U.S. individual station logs. By looking at the raw data temperature graphs of these, you will find similar lack of any hockey stick. It's ironic...these are NOAA stations. They show quite a different record than the so-called combined record shown on the central NOAA site (which itself seems to a copy of the IPCC 'record'). You can find that link at http://cdiac.ornl.gov/epubs/ndp/ushcn/ushcn_map_interface.html. Please be aware that these stations only show the temperature at the bulb of the thermometer of that station. It does not necessarily show the temperature in that area. These stations only cover the lower 48. Alaska and Hawaii do not have NOAA stations (except for the CO2 monitoring station at Mauna Loa). Those stations are privately operated and so their records are not available here. Also be sure to check their reporting reliability data (include in this database). Many stations will send 'interpolated' (manufactured) data when they are offline due to equipment failure. The Parrot Killer Debunked in my sig. - tmiddles Google keeps track of paranoid talk and i'm not on their list. I've been evaluated and certified. - keepit nuclear powered ships do not require nuclear fuel. - Swan While it is true that fossils do not burn it is also true that fossil fuels burn very well - Swan |
| 14-04-2017 04:26 | |
| GasGuzzler★★★★★ (2935) |
http://cdiac.ornl.gov/epubs/ndp/ushcn/ushcn_map_interface.html. This a great website...didn't have much time but checked out one reporting station site I know locally to be a small town. Incredible. No resemblance of the thousands of "compilation" charts you see. I will be interested to poke around here. Thanks! Radiation will not penetrate a perfect insulator, thus as I said space is not a perfect insulator.- Swan Attached image: 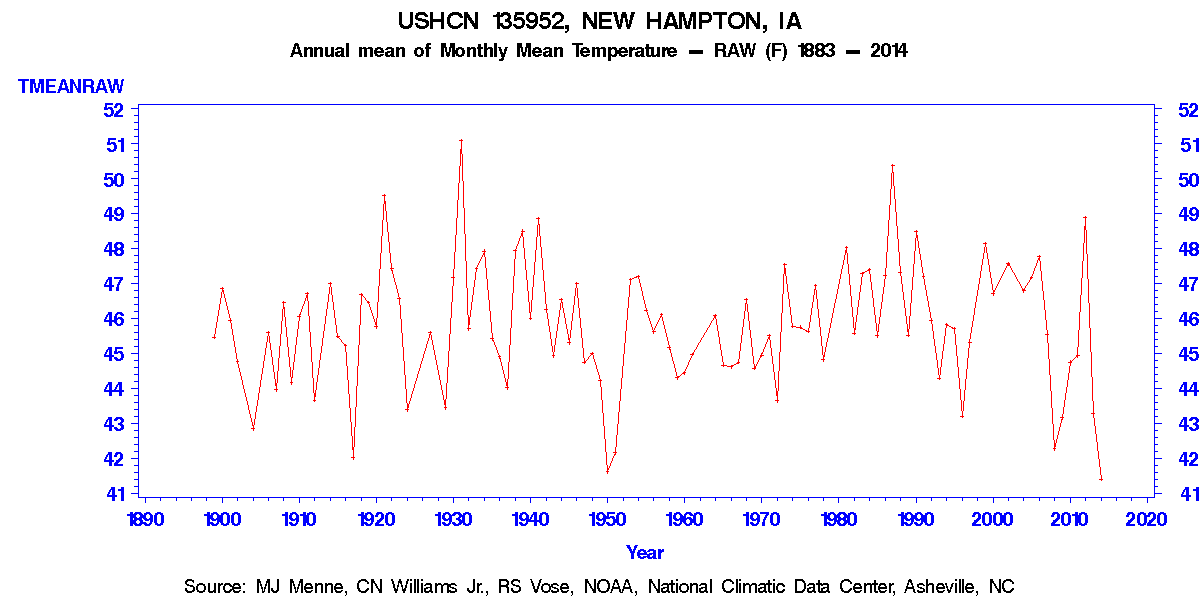
Edited on 14-04-2017 04:54 |
| 14-04-2017 06:00 | |
| litesong★★★★★ (2297) |
GasGuzzler wrote: These minimum temps for New Hampton, IA are interesting: http://cdiac.ornl.gov/cgi-bin/broker?id=135952&_PROGRAM=prog.gplot_meanclim_mon_yr2014.sas&_SERVICE=default¶m=TMIN&minyear=1883&maxyear=2014 Edited on 14-04-2017 06:05 |
| 14-04-2017 06:06 | |
| GasGuzzler★★★★★ (2935) |
litesong wrote:GasGuzzler wrote: Yes they certainly are interesting. Notice how flat that last 30 years is? When everywhere else you'll see a hockey stick? Radiation will not penetrate a perfect insulator, thus as I said space is not a perfect insulator.- Swan Attached image: 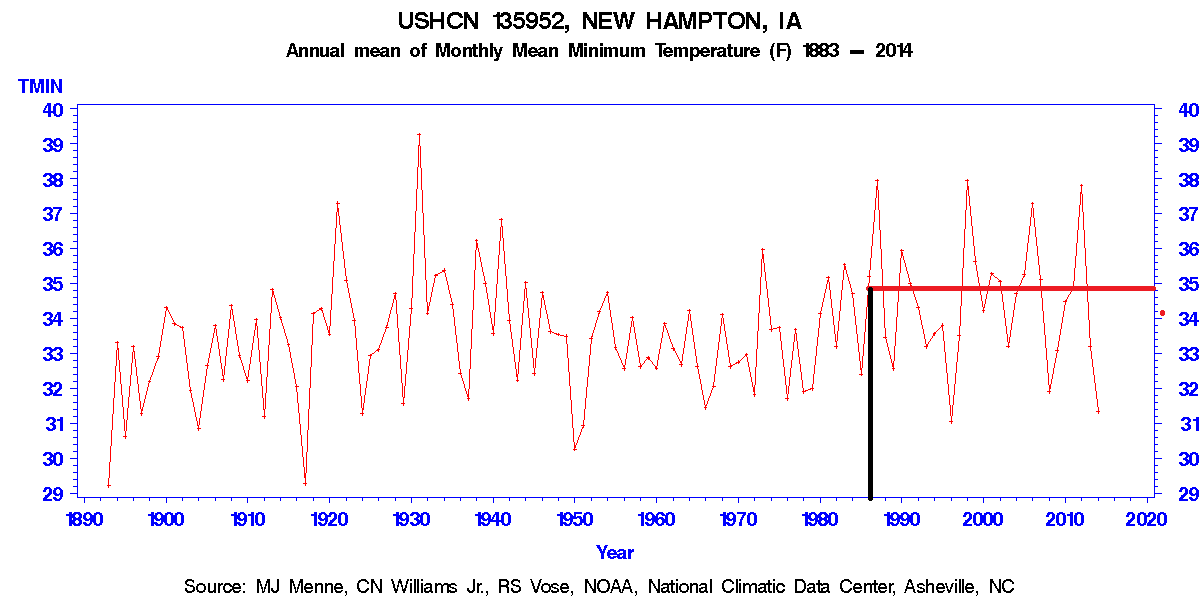 |
| 14-04-2017 06:13 | |
| litesong★★★★★ (2297) |
GasGuzzler wrote:litesong wrote:GasGuzzler wrote: Ah..... you mean during the time the solar TSI was languid for decades & low for the last 10 years (including a 3+ year period where the solar TSI set a 100 year record low TSI). Why does the temperature record show flat, instead of a drop? AGW shows stronger than the solar TSI drop. Edited on 14-04-2017 06:14 |
| 14-04-2017 06:19 | |
| litesong★★★★★ (2297) |
These minimum temperatures for Centralia, Washington are interesting: http://cdiac.ornl.gov/cgi-bin/broker?id=451276&_PROGRAM=prog.gplot_meanclim_mon_yr2014.sas&_SERVICE=default¶m=TMIN&minyear=1890&maxyear=2014 During the time the solar TSI was languid for decades & low for the last 10 years (including a 3+ year period where the solar TSI set a 100 year record low TSI). Why does the temperature record show flat, instead of a drop? AGW shows stronger than the solar TSI drop. |
| 14-04-2017 06:26 | |
| litesong★★★★★ (2297) |
These minimum temperatures for Oakley, ID are interesting: http://cdiac.ornl.gov/cgi-bin/broker?id=186620&_PROGRAM=prog.gplot_meanclim_mon_yr2014.sas&_SERVICE=default¶m=TMIN&minyear=1872&maxyear=2014 During the time the solar TSI was languid for decades & low for the last 10 years (including a 3+ year period where the solar TSI set a 100 year record low TSI). Why does the temperature record show flat, instead of a drop? AGW shows stronger than the solar TSI drop. Edited on 14-04-2017 07:01 |
| 14-04-2017 06:55 | |
| litesong★★★★★ (2297) |
These minimum temperatures for Shelbyville, KY are interesting: http://cdiac.ornl.gov/cgi-bin/broker?id=451276&_PROGRAM=prog.gplot_meanclim_mon_yr2014.sas&_SERVICE=default¶m=TMIN&minyear=1890&maxyear=2014 During the time the solar TSI was languid for decades & low for the last 10 years (including a 3+ year period where the solar TSI set a 100 year record low TSI). Why does the temperature record show a rise after 1990, instead of a drop? AGW shows much stronger than the solar TSI drop. |
| 14-04-2017 06:58 | |
| litesong★★★★★ (2297) |
These minimum temperatures for Oakland, MD are interesting: http://cdiac.ornl.gov/cgi-bin/broker?id=186620&_PROGRAM=prog.gplot_meanclim_mon_yr2014.sas&_SERVICE=default¶m=TMIN&minyear=1872&maxyear=2014 During the time the solar TSI was languid for decades & low for the last 10 years (including a 3+ year period where the solar TSI set a 100 year record low TSI). Why does the temperature record show a rise after 1990, instead of a drop? AGW shows much stronger than the solar TSI drop. |
| 14-04-2017 07:00 | |
| GasGuzzler★★★★★ (2935) |
It took you 49 minutes to find one with a rise? HaHaHaHaHaHaHa!!! Oh you can't even write this stuff! |
| 14-04-2017 07:06 | |
| litesong★★★★★ (2297) |
All the minimum temperatures were rising. During your cherry picked time period you showed a flat temperature, altho you knew the sun had reduced its TSI.... but did not mention it. So far I haven't found any reduced temperatures in the time period you cherry picked to match reduced solar TSI. |
| 14-04-2017 07:23 | |
| GasGuzzler★★★★★ (2935) |
solar tsi and temps don't go lockstep, but I thought you would know that. I picked 1980-90 forward because that is the time period where the hockey stick always shows up. Da? |
| 14-04-2017 07:26 | |
| GasGuzzler★★★★★ (2935) |
You hate this website you're looking at because it throws manure on everything you've been sold. |
| 14-04-2017 07:32 | |
| GasGuzzler★★★★★ (2935) |
litesong wrote: UMMMM the first one YOU posted! Have it you way.... Radiation will not penetrate a perfect insulator, thus as I said space is not a perfect insulator.- Swan Attached image: 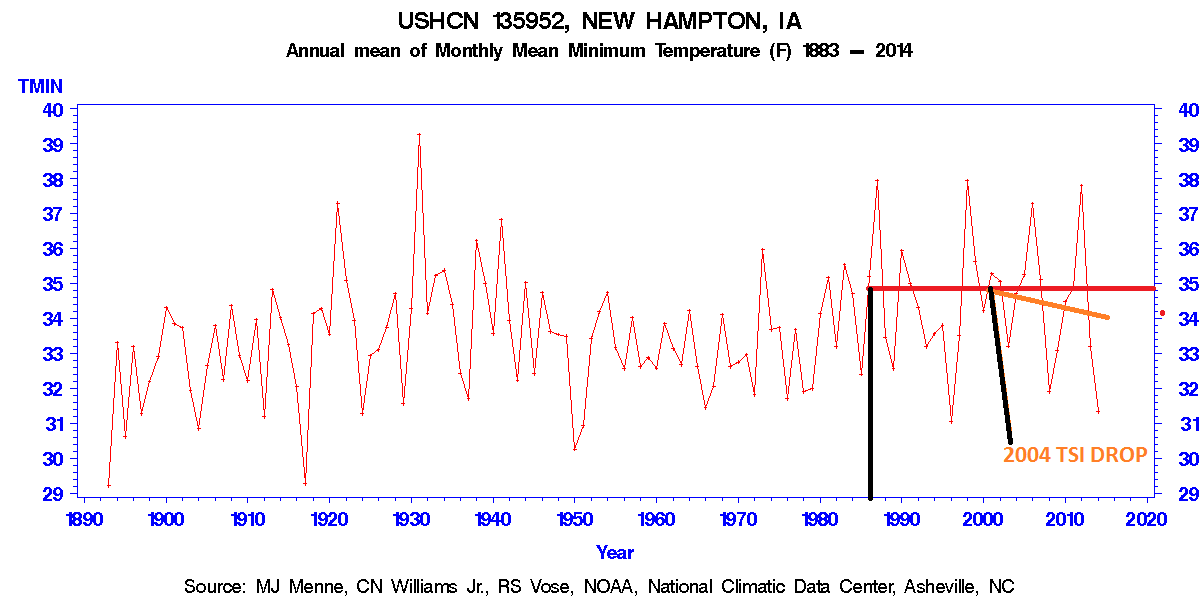 |
| 14-04-2017 07:39 | |
| litesong★★★★★ (2297) |
[b]GasGuzzler wrote: solar tsi and temps don't go lockstep... That's what AGW denier liar whiners keep sayin'...... altho day SAY dat da sun regulates Eart' tempatures. I'm findin' dat solar changes ain't da only thang, but AGW is reg-a-latin' Eart' tempatures, two....too. Edited on 14-04-2017 07:55 |
| 14-04-2017 08:10 | |
| litesong★★★★★ (2297) |
These minimum temperatures for Childs, AZ are interesting: http://cdiac.ornl.gov/cgi-bin/broker?id=021614&_PROGRAM=prog.gplot_meanclim_mon_yr2014.sas&_SERVICE=default¶m=TMIN&minyear=1893&maxyear=2014 During the time the solar TSI was languid for decades & low for the last 10 years (including a 3+ year period where the solar TSI set a 100 year record low TSI). Why does the temperature record show a rise after 1990, instead of a drop? AGW shows much stronger than the solar TSI drop. Edited on 14-04-2017 08:12 |
| 14-04-2017 08:17 | |
| litesong★★★★★ (2297) |
[b]GasGuzzler wrote: Have it you way.... I'll have the AGW way. As you truncate the years, chances increase that yearly weather does its thing..... & ya miss 2015 & 2016.... hot in early 2017 too. Throw enough data away, ya ken make lots of AGW denier liar whiner sigh-ants.... & ya ain't even doing that well. Edited on 14-04-2017 08:18 |
| 14-04-2017 08:22 | |
| litesong★★★★★ (2297) |
Gunnison, CO is interesting: http://cdiac.ornl.gov/cgi-bin/broker?id=053662&_PROGRAM=prog.gplot_meanclim_mon_yr2014.sas&_SERVICE=default¶m=TMIN&minyear=1884&maxyear=2014 |
| 14-04-2017 12:28 | |
| Tim the plumber★★★★☆ (1356) |
PitonObserver wrote:Tim the plumber wrote: Let's just consider the deficit of water per person on the planet. The table below compares the average daily water usage of about 35 countries with the US leading with 575 liters per person per day. Numbers are inportant in science. The numbers you are using are utterly insignificant in the debate over sea level rise. You do not understand the issues at all. |
| 14-04-2017 15:36 | |
| litesong★★★★★ (2297) |
These minimum temperatures for Newark University Farm, DE are interesting: http://cdiac.ornl.gov/cgi-bin/broker?id=076410&_PROGRAM=prog.gplot_meanclim_mon_yr2014.sas&_SERVICE=default¶m=TMIN&minyear=1888&maxyear=2014 During the time the solar TSI was languid for decades & low for the last 10 years (including a 3+ year period where the solar TSI set a 100 year record low TSI). Why does the temperature record show a rise after 1990, instead of a drop? AGW shows much stronger than the solar TSI drop. |
| 14-04-2017 15:40 | |
| litesong★★★★★ (2297) |
These minimum temperatures for Hobart, IN are interesting: http://cdiac.ornl.gov/cgi-bin/broker?id=124008&_PROGRAM=prog.gplot_meanclim_mon_yr2014.sas&_SERVICE=default¶m=TMIN&minyear=1893&maxyear=2014 During the time the solar TSI was languid for decades & low for the last 10 years (including a 3+ year period where the solar TSI set a 100 year record low TSI). Why does the temperature record show a rise after 1990, instead of a drop? AGW shows much stronger than the solar TSI drop. |
| 14-04-2017 15:49 | |
| litesong★★★★★ (2297) |
These minimum temperatures for Seymour, IN are interesting..... & a Blessing: http://cdiac.ornl.gov/cgi-bin/broker?id=127935&_PROGRAM=prog.gplot_meanclim_mon_yr2014.sas&_SERVICE=default¶m=TMIN&minyear=1887&maxyear=2016 During the time the solar TSI was languid for decades & low for the last 10 years (including a 3+ year period where the solar TSI set a 100 year record low TSI). Why does the temperature record show a rise after 1990, instead of a drop? AGW shows much stronger than the solar TSI drop. |
| 14-04-2017 17:33 | |
| Wake★★★★★ (4034) |
Tim the plumber wrote:PitonObserver wrote:Tim the plumber wrote: Tim, Piton is being polite and I think that you should be as well. It appears to me as if he doesn't understand the issues either but you don't mock him but rather explain your point of view. The water per person in the US is high because the population is high and the availability of water is high because we use it for energy. Should we simply then throw it away? Or is the suggestion to ship it elsewhere on the globe? Say the Gobi Desert? |
| 14-04-2017 17:36 | |
| Wake★★★★★ (4034) |
GasGuzzler wrote: You really don't expect litebrain to understand a word you're saying do you? |
| 14-04-2017 18:00 | |
| GasGuzzler★★★★★ (2935) |
Wake wrote:GasGuzzler wrote: No, I didn't. But this time we had pretty pictures to explain things so I thought it was worth a shot. Radiation will not penetrate a perfect insulator, thus as I said space is not a perfect insulator.- Swan |
| 14-04-2017 18:10 | |
| Wake★★★★★ (4034) |
GasGuzzler wrote:Wake wrote:GasGuzzler wrote: And those pretty pictures shot Obama and NOAA in the foot. They plainly show that the corrections for rapid urban growth were extremely underrated. Now it is true that we do not have equally detailed histories of temperature in parts of Europe but only 11 countries mostly dots on the map were under Nazi control and hence lost records and most of those weren't lost at all. When the four horsemen of the apocalypse can lie they try their damndest. |
| 14-04-2017 19:05 | |
| litesong★★★★★ (2297) |
"old sick silly sleepy sleezy slimy steenkin' filthy vile reprobate rooting (& rotting) racist pukey proud pig AGW denier liar whiner gaslighter" gushed: ....pretty pictures... I like dem dar purdy pix-shores fer Lusk, WY: http://cdiac.ornl.gov/cgi-bin/broker?id=485830&_PROGRAM=prog.gplot_meanclim_mon_yr2014.sas&_SERVICE=default¶m=TMIN&minyear=1889&maxyear=2016 During the time the solar TSI was languid for decades & low for the last 10 years (including a 3+ year period where the solar TSI set a 100 year record low TSI). Why does the temperature record show a rise after 1990, instead of a drop? AGW shows much stronger than the solar TSI drop. Edited on 14-04-2017 19:06 |
| 14-04-2017 19:10 | |
| litesong★★★★★ (2297) |
I like dem dar purdy pix-shores fer Pinedale, WY. What a Blessing: http://cdiac.ornl.gov/cgi-bin/broker?id=487260&_PROGRAM=prog.gplot_meanclim_mon_yr2014.sas&_SERVICE=default¶m=TMIN&minyear=1899&maxyear=2015 During the time the solar TSI was languid for decades & low for the last 10 years (including a 3+ year period where the solar TSI set a 100 year record low TSI). Why does the temperature record show a rise after 1990, instead of a drop? AGW shows much stronger than the solar TSI drop. Edited on 14-04-2017 19:13 |
| 14-04-2017 19:17 | |
| GasGuzzler★★★★★ (2935) |
litesong wrote: Good grief woman, get a grip! Why are you only looking at mean minimum? Here's the same location with total monthly mean. Nice try. Radiation will not penetrate a perfect insulator, thus as I said space is not a perfect insulator.- Swan Attached image: 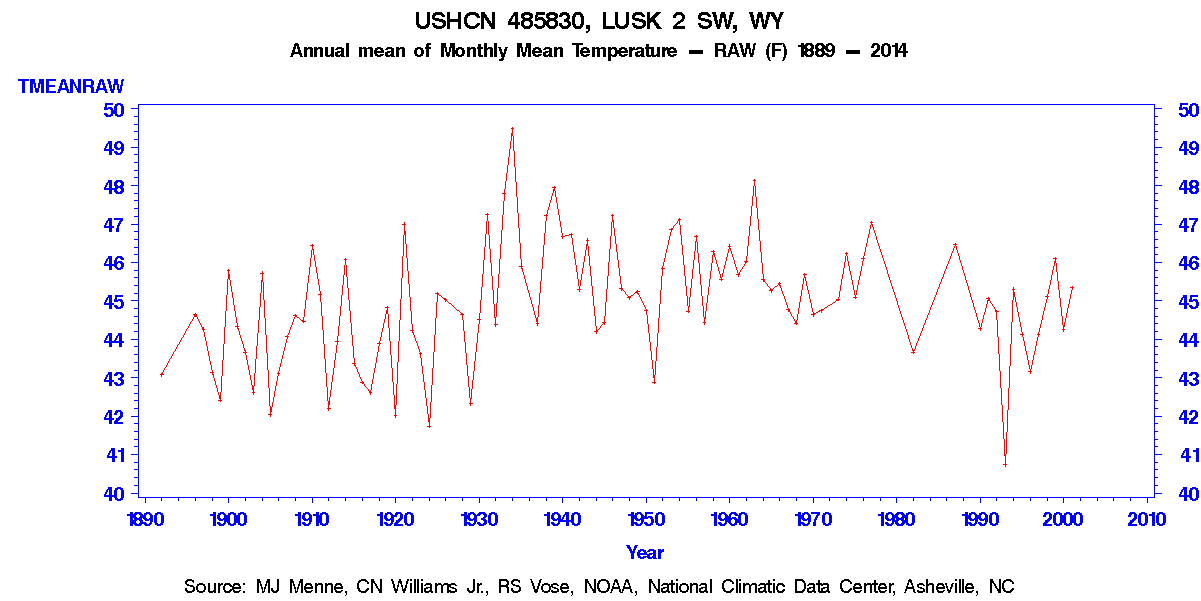 |
| 14-04-2017 19:19 | |
| litesong★★★★★ (2297) |
I like dem dar purdy pix-shores fer Luling, TX. What a Blessing: http://cdiac.ornl.gov/cgi-bin/broker?id=415429&_PROGRAM=prog.gplot_meanclim_mon_yr2014.sas&_SERVICE=default¶m=TMIN&minyear=1882&maxyear=2014 During the time the solar TSI was languid for decades & low for the last 10 years (including a 3+ year period where the solar TSI set a 100 year record low TSI). Why does the temperature record show a rise after 1990, instead of a drop? AGW shows much stronger than the solar TSI drop. |
| 14-04-2017 19:26 | |
| GasGuzzler★★★★★ (2935) |
You mean this one from Luling Texas? Radiation will not penetrate a perfect insulator, thus as I said space is not a perfect insulator.- Swan Attached image: 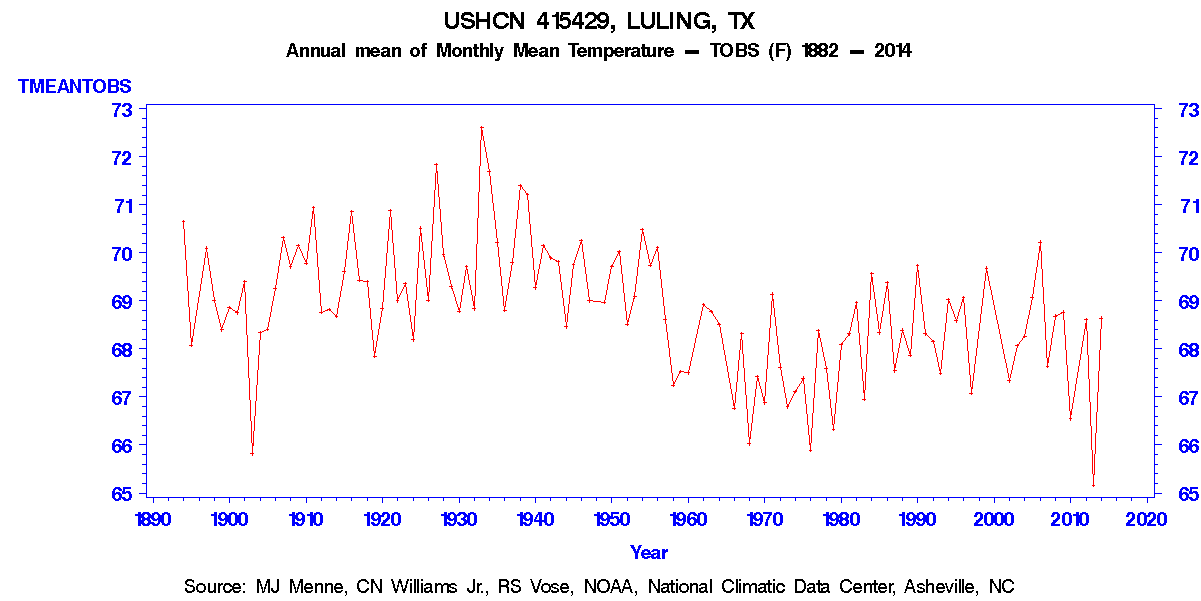 |
| 14-04-2017 19:33 | |
| litesong★★★★★ (2297) |
"old sick silly sleepy sleezy slimy steenkin' filthy vile reprobate rooting (& rotting) racist pukey proud pig AGW denier liar whiner gaslighter" gushed: Why are you only looking at mean minimum? Good that you show the temps that are being affected by solar TSI drop, while I show temps showing GHG increasing resistance to temperature drop in the minimum temperatures. Good fer u!! You continue to show dem dar solar TSI effects, while ah shows da GHG increasing resistance to temperature drop in da minimum temps. We done do make up a team! |
| 14-04-2017 19:42 | |
| litesong★★★★★ (2297) |
★★★☆☆ Posts: 912 Joined: 16.11.16 I like dem dar purdy pix-shores fer Marshall, NC. What a Blessing: http://cdiac.ornl.gov/cgi-bin/broker?id=315356&_PROGRAM=prog.gplot_meanclim_mon_yr2014.sas&_SERVICE=default¶m=TMIN&minyear=1879&maxyear=2014 During the time the solar TSI was languid for decades & low for the last 10 years (including a 3+ year period where the solar TSI set a 100 year record low TSI). Why does the temperature record show a rise after 1990, instead of a drop? AGW shows much stronger than the solar TSI drop. |
| 14-04-2017 19:58 | |
| Tim the plumber★★★★☆ (1356) |
Wake wrote:Tim the plumber wrote:PitonObserver wrote:Tim the plumber wrote: I disagree. I do not see politeness as an objective. Truth is more inportant. Especially when the issue is this serrious. |
| 14-04-2017 20:08 | |
| Wake★★★★★ (4034) |
Tim the plumber wrote:Wake wrote:Tim the plumber wrote:PitonObserver wrote:Tim the plumber wrote: Isn't the whole point that our side is saying that it isn't serious and the True Believers are claiming it is? And yet every one of them is driving a car and their understanding of science suggests they have quite low paying jobs and drive old gas guzzling wrecks. |
Join the debate Climate Change is a Blessing.: