sea levels
| sea levels10-11-2020 09:44 | |
| duncan61★★★★★ (2021) |
I went looking for stuff and found this If one thing more than any other is used to justify proposals that the world must spend tens of trillions of dollars on combating global warming, it is the belief that we face a disastrous rise in sea levels. The Antarctic and Greenland ice caps will melt, we are told, warming oceans will expand, and the result will be catastrophe. Although the UN's Intergovernmental Panel on Climate Change (IPCC) only predicts a sea level rise of 59cm (17 inches) by 2100, Al Gore in his Oscar-winning film An Inconvenient Truth went much further, talking of 20 feet, and showing computer graphics of cities such as Shanghai and San Francisco half under water. We all know the graphic showing central London in similar plight. As for tiny island nations such as the Maldives and Tuvalu, as Prince Charles likes to tell us and the Archbishop of Canterbury was again parroting last week, they are due to vanish. But if there is one scientist who knows more about sea levels than anyone else in the world it is the Swedish geologist and physicist Nils-Axel Mörner, formerly chairman of the INQUA International Commission on Sea Level Change. And the uncompromising verdict of Dr Mörner, who for 35 years has been using every known scientific method to study sea levels all over the globe, is that all this talk about the sea rising is nothing but a colossal scare story. Despite fluctuations down as well as up, "the sea is not rising," he says. "It hasn't risen in 50 years." If there is any rise this century it will "not be more than 10cm (four inches), with an uncertainty of plus or minus 10cm". And quite apart from examining the hard evidence, he says, the elementary laws of physics (latent heat needed to melt ice) tell us that the apocalypse conjured up by Al Gore and Co could not possibly come about. The reason why Dr Mörner, formerly a Stockholm professor, is so certain that these claims about sea level rise are 100 per cent wrong is that they are all based on computer model predictions, whereas his findings are based on "going into the field to observe what is actually happening in the real world". When running the International Commission on Sea Level Change, he launched a special project on the Maldives, whose leaders have for 20 years been calling for vast sums of international aid to stave off disaster. Six times he and his expert team visited the islands, to confirm that the sea has not risen for half a century. Before announcing his findings, he offered to show the inhabitants a film explaining why they had nothing to worry about. The government refused to let it be shown. Similarly in Tuvalu, where local leaders have been calling for the inhabitants to be evacuated for 20 years, the sea has if anything dropped in recent decades. The only evidence the scaremongers can cite is based on the fact that extracting groundwater for pineapple growing has allowed seawater to seep in to replace it. Meanwhile, Venice has been sinking rather than the Adriatic rising, says Dr Mörner. One of his most shocking discoveries was why the IPCC has been able to show sea levels rising by 2.3mm a year. Until 2003, even its own satellite-based evidence showed no upward trend. But suddenly the graph tilted upwards because the IPCC's favoured experts had drawn on the finding of a single tide-gauge in Hong Kong harbour showing a 2.3mm rise. The entire global sea-level projection was then adjusted upwards by a "corrective factor" of 2.3mm, because, as the IPCC scientists admitted, they "needed to show a trend". When I spoke to Dr Mörner last week, he expressed his continuing dismay at how the IPCC has fed the scare on this crucial issue. When asked to act as an "expert reviewer" on the IPCC's last two reports, he was "astonished to find that not one of their 22 contributing authors on sea levels was a sea level specialist: not one". Yet the results of all this "deliberate ignorance" and reliance on rigged computer models have become the most powerful single driver of the entire warmist hysteria. This is the exact conclusion I have drawn myself based on my own research.You see Tmiddles it is all being fabricated and in 20 years time when nothing has changed I will post you my address for you to send your apology letter duncan61 |
| 10-11-2020 10:46 | |
| duncan61★★★★★ (2021) |
I sourced this from Fabius Maximus website Its worth a look it addresses a lot of the issues I am working on |
| 10-11-2020 15:29 | |
| James___★★★★★ (5513) |
Someone had previously posted a link to sea level rise from the last inter glacial period. I know many in here do not trust any type of dating. If we are only 1/2 of the way to maximum seal level rise between ice ages, then catastrophic sea level rise would happen a few thousand years from now. At the same time, the Earth's orbit around the Sun is becoming more elliptical. This simply means that as the years go by, the solar constant will be slowly decreasing. FYI; this is one way sea sediments are dated. From what I've read, there are many ways that are used. And in this quote, please note that their findings are in agreement with the Earth's orbit around the Sun. It is the Earth's orbit which determines what the solar constant is. At the moment it's about 1,366 w/m^2. Here we report the direct U–Th dating of aragonite-rich marine sediments from the Bahamas, and present an accurately dated marine oxygen-isotope record for the last two interglacials. We obtain dates of 120–127 kyr BP for the last interglacial and 189–190 kyr BP for the late stage 7 interglacial. These dates are in accord with the general theory of orbitally forced climate fluctuations and demonstrate the potential of our direct-dating approach for developing an absolute chronology for the Pleistocene marine oxygen-isotope record. https://www.nature.com/articles/383242a0 |
| 10-11-2020 18:04 | |
Into the Night ★★★★★ ★★★★★(21597) |
James___ wrote: More quoting of made up shit. There is no reference scale for such dating. The Parrot Killer Debunked in my sig. - tmiddles Google keeps track of paranoid talk and i'm not on their list. I've been evaluated and certified. - keepit nuclear powered ships do not require nuclear fuel. - Swan While it is true that fossils do not burn it is also true that fossil fuels burn very well - Swan |
| 11-11-2020 01:24 | |
| duncan61★★★★★ (2021) |
As per usual james I have no idea where you are going.The topic is sea level rise because of AGW |
| 11-11-2020 03:04 | |
HarveyH55 ★★★★★ ★★★★★(5197) |
duncan61 wrote: Does he mean that for the last 7 inter-glacial periods, there was considerable use of fossil fuels? We really aren't do anything. |
| 11-11-2020 03:56 | |
| James___★★★★★ (5513) |
duncan61 wrote: If we're not aware of sea level rises in the past, then we have nothing to compare to. As far as AGW goes, oxygen levels have decreased by 0.06%. With CO2, it has increased by 0.02%. Oxygen is highly reactive and helps to radiate and/or move heat out of the Earth's atmosphere. Most oxygen is probably lost due to manufacturing processes. Any process that requires oxygen as an oxidizer is removing oxygen from our atmosphere. As far as sea level rise is concerned, it's such a slow process that if we can't adapt, then we have problems. Please remember this for future reference. I have recently mentioned this and having to do so again so soon shouldn't be necessary. |
| 11-11-2020 05:58 | |
| keepit★★★★★ (3058) |
You don't have to measure the temp, just measure the change in temp. |
| 11-11-2020 08:10 | |
| Into the Night★★★★★ (21597) |
keepit wrote: Base rate fallacy. It is not possible to measure the temperature of the Earth. The Parrot Killer Debunked in my sig. - tmiddles Google keeps track of paranoid talk and i'm not on their list. I've been evaluated and certified. - keepit nuclear powered ships do not require nuclear fuel. - Swan While it is true that fossils do not burn it is also true that fossil fuels burn very well - Swan |
| 11-11-2020 13:15 | |
| duncan61★★★★★ (2021) |
Amberley is 1 degree Celsius cooler than 1942 where the thermometer is.Absolute recorded fact.What now do you say its warming some where else but not there |
| 11-11-2020 17:47 | |
| HarveyH55★★★★★ (5197) |
duncan61 wrote: That's where the amazing, mathemagic kicks in. You are only looking at one location, but that's not global average temperature. Somewhere else, it's 3 C warmer, than it was in 1942. Funny how new math works. A 1 C cooling, in one location doesn't mean anything. Yet, we can't possibly have enough temperature readings and records, to have any meaningful average global temperature, for any given year. Math and nature doesn't play well, and seldom works out the same on paper. A farmer, will plant his crops, calculate his yield, and likely profits for the season. But, he knows that there is no way of knowing how well his crops will do, or what the actual market price will be. |
| 11-11-2020 19:21 | |
| James___★★★★★ (5513) |
Maybe cool ocean water that circulates around Antarctica might have something to do with things? It does seem that as it's current moves away from Antarctica that when either Africa, South America or Australia is in its path, it has a current flowing northward. As such, the current flows past the eastern side of Australia towards Adelaide. If those waters haven't warmed, could help to keep the southern coast from warming. In a way it's similar to the Gulf Stream warming Europe because it transports equatorial heat. If not for this, Europe would be much cooler. |
| 11-11-2020 19:40 | |
| Into the Night★★★★★ (21597) |
duncan61 wrote: That kind of thing happens a lot with the Church of Global Warming. They take a thermometer reading over time that doesn't agree with their scripture and simply discard it, saying that it doesn't represent the global temperature (they're right on that!). It is not possible to measure the global temperature of Earth. The Parrot Killer Debunked in my sig. - tmiddles Google keeps track of paranoid talk and i'm not on their list. I've been evaluated and certified. - keepit nuclear powered ships do not require nuclear fuel. - Swan While it is true that fossils do not burn it is also true that fossil fuels burn very well - Swan |
| 11-11-2020 19:46 | |
| Into the Night★★★★★ (21597) |
HarveyH55 wrote:duncan61 wrote: The 'new math' of the Church of Global Warming completely fails to take into account location grouping, a significant biasing factor. They also fail to take into account time, another significant biasing factor. Thermometer readings they use are not uniformly spread across the surface of the Earth nor read at the same time by the same authority. Storms move. Wind blows. Earth is only lit on one side at a time and the Earth spins. Time is significant. Thermometers are located in and near cities and roads (they must be serviced). 100 thermometers in a city tells you nothing about a location only a few miles away. There are not enough thermometers. Uniformly spread, there will be one thermometer to measure an area the size of the State of Virginia. Obviously, not good enough. Temperature can easily vary as much as 20 deg F per mile. The lowest possible margin of error, using the thermometers we have, is greater than the highest and lowest temperatures ever recorded on Earth. Mathematically, they're guessing. There is no valid record of global temperature. The Parrot Killer Debunked in my sig. - tmiddles Google keeps track of paranoid talk and i'm not on their list. I've been evaluated and certified. - keepit nuclear powered ships do not require nuclear fuel. - Swan While it is true that fossils do not burn it is also true that fossil fuels burn very well - Swan |
| 12-11-2020 13:05 | |
| duncan61★★★★★ (2021) |
Found a site that showed how the average temperature in North America is measured and over 60% of the instruments were classed as 5 which is poor with a plus minus variation of 5 degrees there were a few class 2 which are plus minus 2 degree which is considered fair.I will see if I can find it again |
| 12-11-2020 15:33 | |
| James___★★★★★ (5513) |
duncan61 wrote: And no link? My pc automatically deletes history. Kind of why when I use it, I post links at that time. Your pc most likely saves your history. And why do I delete my history, if someone else somehow got a hold of my pc and could hack my password, they won't know where I bank. And I'll probably have my pc quit remembering passwords, kind of defeats the purpose of having a password if there's not a secondary verification which would be my phone which I always keep with me. Edited on 12-11-2020 15:40 |
| 12-11-2020 16:50 | |
| duncan61★★★★★ (2021) |
I went looking through history and could not find it.It showed where all the weather stations are and what type |
| 12-11-2020 18:07 | |
| HarveyH55★★★★★ (5197) |
duncan61 wrote: That one of the things I noticed a long time ago. The recorded measurements were never need to be highly precise, like in a lab, just reasonably consistent. +/- 5 degrees is pretty significant, when we are told to be 'afraid', of just a 1 degree raise, stretched out over a century. That 1 degree, is well with in the tolerance of the instruments. There is also a much larger margin of error, when compiling the past records, from all over the world. Of course, we don't have a complete data set, some records were lost, or just missing. Almost all are land based, which is about 20% of the planet surface. Office record keep only started in 1898, and a standard set. Just never made any sense why these people a soiling their pants, over computer projections, that are well withing the margin of error. The could just as easily show global cooling, at the same rate, and be just as accurate. Pretty much every place on the planet, has experienced some sort of brutal,weather extremes. Heat waves, usually harsh winters, '100 year storms'... There is no baseline 'normal', to compare with. And yet, these experts are selling a rapid change, from a 'normal'. Basically, they agreed that a number, is what they would consider as 'normal', and the agreed their data showed there was a change, from what they determined to be 'normal'. |
| 12-11-2020 18:19 | |
| HarveyH55★★★★★ (5197) |
James___ wrote:duncan61 wrote: Most people who delete there history, generally try to hide their dirty secrets. You don't actual remove all your activities, from the browsers, or your computer. You just have to dig into your computer deeper, to find those dirty little secrets. The auto-delete, makes you feel good, feel safe, trust, but doesn't really do the job. There probably are programs, that will go through and scrub your PC clean. But there are probably also thousands of others, that claim to do the job, but don't do much of anything. Best not to visit sites, that might be embarrassing. You know all those 'updates' you operating system does? Guess what, they also send a copy of your usage data, for marketing, and product improvements... |
| 12-11-2020 19:10 | |
| James___★★★★★ (5513) |
HarveyH55 wrote:James___ wrote:duncan61 wrote: Since I don't visit the websites of businesses that I do financial business with on a regular basis, more than likely the deleted history will be too fragmented to be of any use. |
| 12-11-2020 19:28 | |
| Into the Night★★★★★ (21597) |
duncan61 wrote: Instrument tolerance problems are completely outclassed by margin of error problems. Temperature can vary as much as 11 deg C per mile. We simply don't have enough thermometers, they aren't space uniformly (location grouping is a significant biasing factor), and they are not read at the same time by the same authority (time is a significant biasing factor). The resulting margin of error is high that it exceeds the highest and lowest temperatures ever recorded on Earth. In other words, mathematically, they're guessing. There is no global temperature data possible. NASA global temperature 'data' is nothing but random numbers. NOAA global temperature 'data' is nothing but random numbers. Both are just random numbers of type randU (a number out of someone's head, or out of some algorithm from someone's head that doesn't make use of randR sources, such as your typical crappy computer random number generator. The Parrot Killer Debunked in my sig. - tmiddles Google keeps track of paranoid talk and i'm not on their list. I've been evaluated and certified. - keepit nuclear powered ships do not require nuclear fuel. - Swan While it is true that fossils do not burn it is also true that fossil fuels burn very well - Swan |
| 13-11-2020 00:51 | |
| duncan61★★★★★ (2021) |
Well explained ITN This is what I have discovered as well.You may have known all along but thanks for carrying us beginners |
| 13-11-2020 05:57 | |
| Into the Night★★★★★ (21597) |
duncan61 wrote: *humble bow* The Parrot Killer Debunked in my sig. - tmiddles Google keeps track of paranoid talk and i'm not on their list. I've been evaluated and certified. - keepit nuclear powered ships do not require nuclear fuel. - Swan While it is true that fossils do not burn it is also true that fossil fuels burn very well - Swan |
| 22-11-2020 08:44 | |
| duncan61★★★★★ (2021) |
Back to sea levels.Can anyone take a picture from somewhere and show me where it was and now where it is.The sea has not gone up where I live |
| 22-11-2020 09:45 | |
tmiddles ★★★★★ ★★★★★(3979) |
duncan61 wrote: Why don't you start with a prediction from the best prognosticators you can find for AGW on sea level rise. Then you can test their estimates/predictions. I don't believe "you can tell from this photo" is something I've come across on the topic. My understanding is that dramatic sea level changes over the last 50 years are not part of the theory, only very small ones. https://www.climate.gov/news-features/understanding-climate/climate-change-global-sea-level 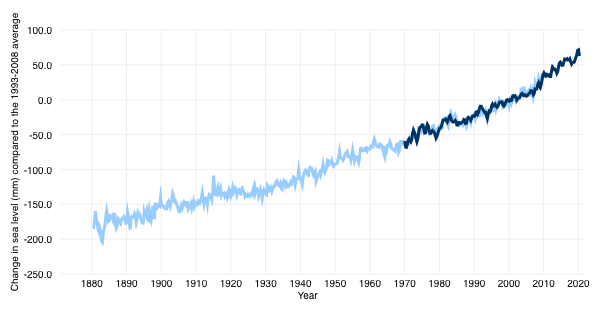 That is showing a 100 MM change from 1970 to 2020, so that would be 10cm. So that is a 4" change in 50 years they are claiming. High tide to low tide is about 2.8 feet: https://tidesandcurrents.noaa.gov/noaatidepredictions.html?id=8454049 MORE IMPORTANTLY!!! Look at the sea level change from 1880 through the early 1900s. Does it look like it got much steeper when CO2 spiked? Nope. So the difference between non AGW sea level rise and whatever CO2 is causing, if that is happening, is simply not going to be detectable in a photo. No way. Tangier Island , should it be used as an example? So I don't think some old black and white photos are going to get this done. "Good tests kill flawed theories; we remain alive to guess again." - Karl Popper ITN/IBD Fraud exposed: The 2nd LTD add on claiming radiance from cooler bodies can't be absorbed Max Planck debunks, they can't explain:net-thermal-radiation-you-in-a-room-as-a-reference & Proof: no data is valid for IBD or ITN Edited on 22-11-2020 10:14 |
| 22-11-2020 15:08 | |
| James___★★★★★ (5513) |
And then there is this; Scientists have discovered what they think may be another reason why Greenland's ice is melting: a thin spot in Earth's crust is enabling underground magma to heat the ice. https://www.sciencedaily.com/releases/2007/12/071212103004.htm Under the thicker glacial ice on Greenland, it would be much more difficult to find such hot spots. Also, as glaciers melt, the number of earthquakes increase. This increased activity in earthquakes could allow for magma close to the Earth's surface to move closer to it. Basically when magma starts to cool closer to the Earth's surface, it will fall back into the Earth's mantle like what happens in a lava lamp. [url] https://www.youtube.com/watch?v=xB5FUYNXt9c[/url] |
| 23-11-2020 00:35 | |
| Into the Night★★★★★ (21597) |
tmiddles wrote:duncan61 wrote: It is not possible to measure global sea level. There is no valid reference point. The Parrot Killer Debunked in my sig. - tmiddles Google keeps track of paranoid talk and i'm not on their list. I've been evaluated and certified. - keepit nuclear powered ships do not require nuclear fuel. - Swan While it is true that fossils do not burn it is also true that fossil fuels burn very well - Swan |
| 23-11-2020 00:35 | |
| Into the Night★★★★★ (21597) |
James___ wrote: Greenland's ice isn't melting. The Parrot Killer Debunked in my sig. - tmiddles Google keeps track of paranoid talk and i'm not on their list. I've been evaluated and certified. - keepit nuclear powered ships do not require nuclear fuel. - Swan While it is true that fossils do not burn it is also true that fossil fuels burn very well - Swan |
| 23-11-2020 09:21 | |
| duncan61★★★★★ (2021) |
High tide to low tide is about 2.8 feet: https://tidesandcurrents.noaa.gov/noaatidepredictions.html?id=8454049 I went here and am interested to see how far in to the future can the tide charts be predicted and do they show a rise on average |
| 23-11-2020 09:55 | |
| duncan61★★★★★ (2021) |
Visit the longest jetty in the north of Western Australia and Immerse yourself in local history at the Heritage Precinct, located on the site of the 1890's Port of Carnarvon, just 3km from the centre of town. November 26 2021 tide predictions MO 0042 1.35 0538 0.84 1200 1.74 1845 0.37 The earliest I could go back is MON 2 Jan 2017 12:35 am 1.63m 7:24 am 0.35m 2:11 pm 1.44m 7:14 pm 0.94m I challenge anyone to find the raw tide data that will show no sea level rise.Its all blocked here in West Australia and this is happening too.The uni students are digitising the records pre 1975.I read changing also this is happening Average temperature trends across Western Australia Below is an approximate 110 year comparison of average annual mean minimum and maximum temperatures at 32 different locations across Western Australia, including weather in the capital city of Perth. The temperature averages have been extracted from the database publicly available at the Australian Bureau of Meteorology website for Western Australia, and from the first ever climate study conducted in the colony of Western Australia before 1900. 32 combined average temperatures Hot spots Coastal locations above 20,000 people Coastal locations below 20,000 people Inland locations All locations except hot spots Earliest colonial data comparison Met Bureau analysis and forecasts Climate change in the Press Contact The 32 locations are selected as these are the only ones on the public database with consistent historic weather records from around 1900 to 2000 and/or 2010. Some location records precede 1900 and some begin just after 1900. Many locations have seen their temperature recording stations moved since 1900, often from the town post office to a nearby airport. These locational changes may affect temperature readings. Aerial photographs are linked below so you can see the changes in location. The annual mean minimum and maximum data are also linked below where available at locations surveyed by the Bureau of Meteorology in its analysis of "corrected" temperature trends from 1910 to 2008. Average mean minimum and maximum temperatures are calculated from November 2019 to October 2020, the most recent 12 month timeframe. Albeit accurate, this recent 12 month data for each location should be considered statistically unreliable due to its brevity compared with "climate normals" that have typical year-to-year weather variations smoothed over standard periods (commonly 30 years). This page is designed to provide a simple, convenient tool for people to observe temperature trends since weather records began in Western Australia, particularly in the context of perceived climate change. Spotlights |
| 23-11-2020 10:10 | |
| duncan61★★★★★ (2021) |
If you go in to the actual charts the Acorn results are not even close to the raw data |
| 23-11-2020 13:37 | |
| tmiddles★★★★★ (3979) |
duncan61 wrote: I think maybe you didn't see my earlier post. The change in overall sea level that noaa has calculated back to 1880 shows an increase of about 4", 10cm, in 50 years. So if there were a consistent change indicated in the tidal prediction, let's say 1 year from now, it would be 2 millimetres. Let me repeat that: A change of 2 millimetres a year from now would be the change consistent with what they show for the past 50 years. So this is not an area where you're going to find much of anything you can call conclusive. The changes are just too tiny. "Good tests kill flawed theories; we remain alive to guess again." - Karl Popper ITN/IBD Fraud exposed: The 2nd LTD add on claiming radiance from cooler bodies can't be absorbed Max Planck debunks, they can't explain:net-thermal-radiation-you-in-a-room-as-a-reference & Proof: no data is valid for IBD or ITN Edited on 23-11-2020 13:43 |
| 23-11-2020 14:44 | |
| duncan61★★★★★ (2021) |
I need to clear something up is it 10cm every 50 years or 10cm from 1880 to now I am confused |
| 23-11-2020 15:13 | |
| James___★★★★★ (5513) |
duncan61 wrote: Specific sea level rise in the future might be difficult to predict. If the melting of glaciers on Greenland or Iceland is tied in with tectonic plate rebound, then as more glacial melt occurs, tectonic plate rebound will continue. I don't think scientists have considered this scenario. If you look at how many earthquakes there are in that area, they are the result of tectonic plate rebound. In the last 10 years there have been 905 earthquakes 2.5 magnitude or greater with 253 of those being 4.5 magnitude or greater. Attached image: 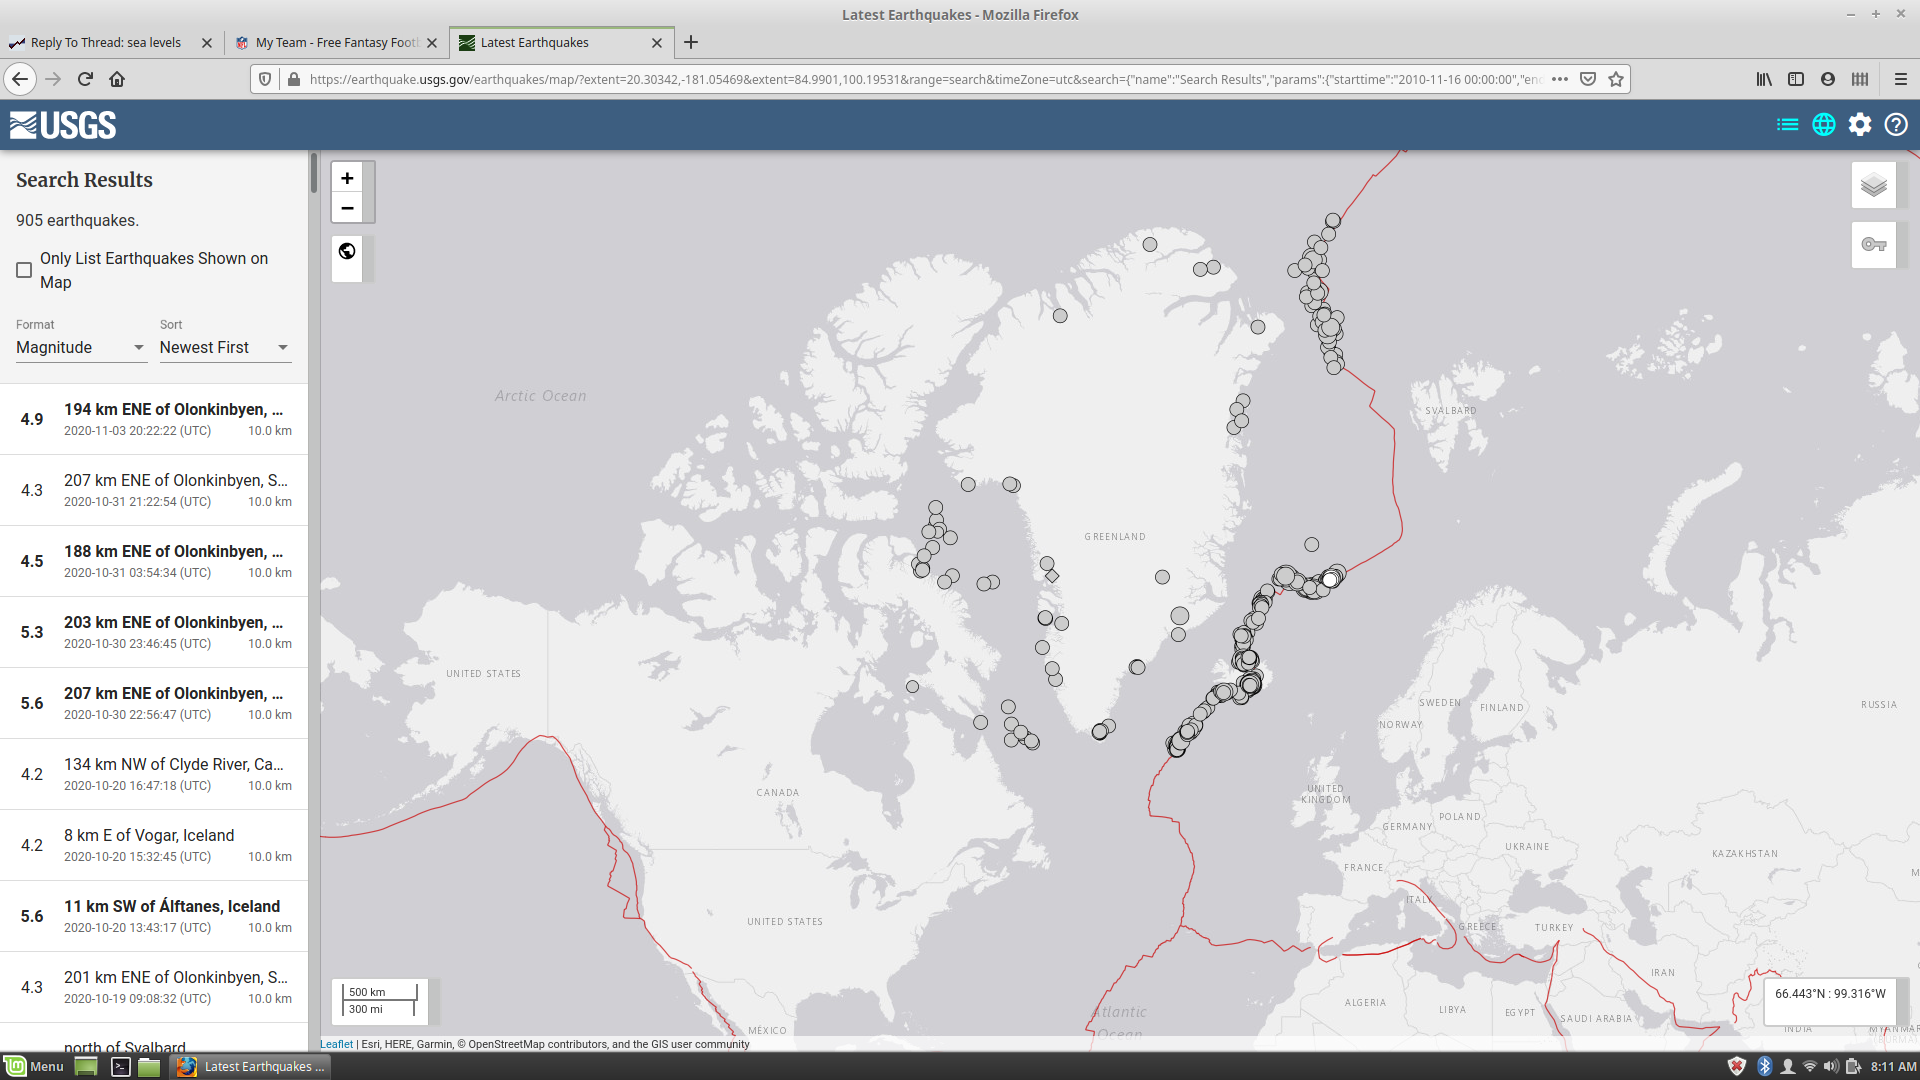 |
| 23-11-2020 15:48 | |
| James___★★★★★ (5513) |
The previous post was about the upper latitudes of the northern hemisphere. This quote and link are about the warming occurring on the western shelves of Antarctica. The last paragraph also applies to what is happening around Greenland and Iceland. Since the initial posting of the Plate Climatology Theory here at Climate Change Dispatch, new information has been continually incorporated into the theory thereby substantiating its basic premises. The theory was considered "plausible," and it was suggested that climate scientists should at the very least give it some consideration. Recently, Antarctic Ice Core research confirmed that two very powerful sub-glacial volcanic eruptions occurred in modern times on the Antarctic Continent, which pushes the Plate Climatology Theory into the "probable" category. In a nutshell, increased global tectonic activity equates to more faulting and crustal plate movement which leads to more geothermal heat and in many cases associated fluid release from faults, fractures, and volcanoes that are more active. Altered heat and fluid release equates to changes in the climate. http://www.plateclimatology.com/evidence-shows-geothermal-activity-linked-to-west-antarctic-ice-melt Edited on 23-11-2020 15:50 |
| 23-11-2020 15:55 | |
IBdaMann ★★★★★ ★★★★★(14406) |
James___ wrote: Specific sea level rise in the future might be difficult to predict. Wait, let me break this down. Are you saying that there is a chance however remote that it might not be a sure bet that the sea level will rise fifteen cubits by the end of the century? That's crazy talk! James___ wrote: If the melting of glaciers on Greenland or Iceland is tied in with tectonic plate rebound, then as more glacial melt occurs, tectonic plate rebound will continue. The Greenland ice mass is increasing. That much is settled. James___ wrote: I don't think scientists have considered this scenario. There's a good reason for that. James___ wrote: If you look at how many earthquakes there are in that area, they are the result of tectonic plate rebound. They never get any points off the rebound. James___ wrote: In the last 10 years there have been 905 earthquakes 2.5 magnitude or greater with 253 of those being 4.5 magnitude or greater. California's 425,000 square kilometers has had ... 25 earthquakes in the past 24 hours 163 earthquakes in the past 7 days 707 earthquakes in the past 30 days 11,505 earthquakes in the past 365 days ... vs. Greenland's 2,166,000 km^2 has had ... 0 earthquakes in the past 24 hours 19 earthquakes in the past 365 days This is clearly due to the tectonic plate rebounding from the rapid melt of the California ice sheet. . I don't think i can [define it]. I just kind of get a feel for the phrase. - keepit A Spaghetti strainer with the faucet running, retains water- tmiddles Clouds don't trap heat. Clouds block cold. - Spongy Iris Printing dollars to pay debt doesn't increase the number of dollars. - keepit If Venus were a black body it would have a much much lower temperature than what we found there.- tmiddles Ah the "Valid Data" myth of ITN/IBD. - tmiddles Ceist - I couldn't agree with you more. But when money and religion are involved, and there are people who value them above all else, then the lies begin. - trafn You are completely misunderstanding their use of the word "accumulation"! - Climate Scientist. The Stefan-Boltzman equation doesn't come up with the correct temperature if greenhouse gases are not considered - Hank :*sigh* Not the "raw data" crap. - Leafsdude IB STILL hasn't explained what Planck's Law means. Just more hand waving that it applies to everything and more asserting that the greenhouse effect 'violates' it.- Ceist |
| 23-11-2020 16:18 | |
| tmiddles★★★★★ (3979) |
IBdaMann wrote:It would seem the world disagrees with you. Citation please. settled adjective agreed upon; decided: So nope, not settled. "Good tests kill flawed theories; we remain alive to guess again." - Karl Popper ITN/IBD Fraud exposed: The 2nd LTD add on claiming radiance from cooler bodies can't be absorbed Max Planck debunks, they can't explain:net-thermal-radiation-you-in-a-room-as-a-reference & Proof: no data is valid for IBD or ITN |
| 23-11-2020 16:35 | |
| IBdaMann★★★★★ (14406) |
tmiddles wrote:IBdaMann wrote:It would seem the world disagrees with you. It seems that you still think you speak for the world. All people who have actually lived in Greenland agree with me. Dishonest warmizombies (I know, redundant) such as yourself have this strange obsession with being dishonest and feel compelled to preach the Global Warming dogma under the pretense that its physics violations are somehow "thettled thienth." tmiddles wrote: Citation please. Nope. The Greenland ice sheet itself is my citation. Go to Greenland and leave an object out on the ice sheet while recording its exact geolocation. It will become buried under a couple of meters of the accumulating Greenland ice after only one year. I will leave it to you to verify this for yourself. Enjoy. . I don't think i can [define it]. I just kind of get a feel for the phrase. - keepit A Spaghetti strainer with the faucet running, retains water- tmiddles Clouds don't trap heat. Clouds block cold. - Spongy Iris Printing dollars to pay debt doesn't increase the number of dollars. - keepit If Venus were a black body it would have a much much lower temperature than what we found there.- tmiddles Ah the "Valid Data" myth of ITN/IBD. - tmiddles Ceist - I couldn't agree with you more. But when money and religion are involved, and there are people who value them above all else, then the lies begin. - trafn You are completely misunderstanding their use of the word "accumulation"! - Climate Scientist. The Stefan-Boltzman equation doesn't come up with the correct temperature if greenhouse gases are not considered - Hank :*sigh* Not the "raw data" crap. - Leafsdude IB STILL hasn't explained what Planck's Law means. Just more hand waving that it applies to everything and more asserting that the greenhouse effect 'violates' it.- Ceist |
| 23-11-2020 19:28 | |
| Into the Night★★★★★ (21597) |
tmiddles wrote:duncan61 wrote: Random numbers used as data. Argument from randU fallacy. The Parrot Killer Debunked in my sig. - tmiddles Google keeps track of paranoid talk and i'm not on their list. I've been evaluated and certified. - keepit nuclear powered ships do not require nuclear fuel. - Swan While it is true that fossils do not burn it is also true that fossil fuels burn very well - Swan |
| 23-11-2020 19:28 | |
| Into the Night★★★★★ (21597) |
duncan61 wrote: So is he. The Parrot Killer Debunked in my sig. - tmiddles Google keeps track of paranoid talk and i'm not on their list. I've been evaluated and certified. - keepit nuclear powered ships do not require nuclear fuel. - Swan While it is true that fossils do not burn it is also true that fossil fuels burn very well - Swan |
Join the debate sea levels:
Related content
| Threads | Replies | Last post |
| Lake Mead Water Levels Stage A Comeback? | 4 | 31-05-2023 23:03 |
| FASTER GLACIER MELTING MECHANISM COULD CAUSE HUGE SEA LEVEL RISES | 4 | 20-05-2023 19:54 |
| Rip current in the Caspian Sea | 0 | 24-08-2022 11:59 |
| Satellite Measurements-- Sea Level Rise | 71 | 24-08-2022 01:36 |
| Arctic sea ice cover | 19 | 09-04-2022 08:29 |