Arctic waters not freezing
| 31-01-2017 03:57 | |
| GasGuzzler★★★★★ (2933) |
Surface Detail wrote:GasGuzzler wrote: Well it's good you have such a concrete understanding. You should be a consultant for NOAA. Here's a few quotes from them on water vapor. Here's your link. https://www.ncdc.noaa.gov/monitoring-references/faq/greenhouse-gases.php This is referred to as a 'positive feedback loop'. However, huge scientific uncertainty exists in defining the extent and importance of this feedback loop. The feedback loop in which water is involved is critically important to projecting future climate change, but as yet is still poorly measured and understood. As yet, though the basics of the hydrological cycle are fairly well understood, we have very little comprehension of the complexity of the feedback loops. while we have good atmospheric measurements of other key greenhouse gases such as carbon dioxide and methane, we have poor measurements of global water vapor Now, about the mankind CO2 contribution 30% you claim-I have found 3% 6% 11%, however, I don't see 30%. My 3% quotes Dept of Energy. I don't care what that number is, what I find interesting is the massive amount of calculations that, I admittedly will never be able to do, going into this discussion. Yet the "experts" are still arguing about the raw numbers. Does that raise any level of concern in your mind? [img][/img] Radiation will not penetrate a perfect insulator, thus as I said space is not a perfect insulator.- Swan Attached image:  |
| 31-01-2017 07:12 | |
| litesong★★★★★ (2297) |
litesong wrote: The warm western component now is on the U.S. Dakotas & Montana, & extends northwest, increasing powerfully in Canada, Yukon, northern Alaska, & onto the southern Arctic Ocean north of Alaska & eastern Siberia.....The eastern warm component has shifted to northeastern Canada, & onto the Davis Strait, & southern Greenland, chasing the Greenland Ice Sheet cold front to the shores of North & East Greenland shores, the Greenland Sea, Svalbard & Iceland. Forecasts indicate the FAB & the previous Ice Sheet cold should continue to battle. Some warmth from the south may take over one footing of the cold on Iceland. Warmth DID take over Iceland & the past cold front on the Greenland Ice Sheet is thinned & jammed on eastern & northern shores of Greenland. The western warm component has thickened at its northeast end north of eastern Siberia, extending toward the North Pole. The warmth that spans from Scandinavia to western Siberia, appears to extend toward the North Pole region, too. But so far, the Present High Arctic Berserker or PHAB or FAB appears NOT to be strengthened. Also, west of the western warm component (which extends to north of eastern Siberia on the Arctic Ocean), a west coast Canadian cold front is developing (which formed from previous cold that was over the western U.S.) & may align along the western warm component. Wow! This might continue, i understand. Edited on 31-01-2017 07:48 |
| 31-01-2017 10:25 | |
| Surface Detail★★★★☆ (1673) |
GasGuzzler wrote: The experts are not arguing about the numbers, at least not when it comes to the amount of CO2 in the atmosphere that is of human origin. You'd have to be very gullible to believe that everything you read on the internet is the work of an expert. The concentration of CO2 remained at about 270-280 ppm for the last 8,000 years or so, but has suddenly shot up to 405 ppm over the last 150 years or so. The only possible explanation for this sudden rise is emissions from human industrial activity. Therefore humans are responsible for about (405 - 275) / 405 = 32% of the current CO2 content of the atmosphere. It's a very simple calculation. Now, how about you give a link to the source of the data on which the graphic you posted is based. Where, exactly, does this supposed 3.2% figure for man-made CO2 come from? |
| 31-01-2017 16:22 | |
| litesong★★★★★ (2297) |
Surface Detail wrote: The concentration of CO2 remained at about 270-280 ppm for the last 8,000 years or so, but has suddenly shot up to 405 ppm over the last 150 years or so. The only possible explanation for this sudden rise is emissions from human industrial activity. Therefore humans are responsible for about (405 - 275) / 405 = 32% of the current CO2 content of the atmosphere. It's a very simple calculation. You sicced him good! |
| 31-01-2017 16:24 | |
| litesong★★★★★ (2297) |
litesong wrote:litesong wrote: The warm western component now is on the U.S. Dakotas & Montana, & extends northwest, increasing powerfully in Canada, Yukon, northern Alaska, & onto the southern Arctic Ocean north of Alaska & eastern Siberia.....The eastern warm component has shifted to northeastern Canada, & onto the Davis Strait, & southern Greenland, chasing the Greenland Ice Sheet cold front to the shores of North & East Greenland shores, the Greenland Sea, Svalbard & Iceland. Forecasts indicate the FAB & the previous Ice Sheet cold should continue to battle. Some warmth from the south may take over one footing of the cold on Iceland. |
| 31-01-2017 19:01 | |
| GasGuzzler★★★★★ (2933) |
Surface Detail wrote:GasGuzzler wrote: I've wasted a ton of time trying to find your 30% "simple calculation" number. YOU post up a link. I googled hundreds of articles claiming anywhere from 3.2 to 11%, but those articles are from skeptics. Most of my time was spent trying to find a report from an alarmist site that shows ANY comparison of natural vs Man made CO2. Interestingly enough, for such a basic number, it's pretty scarce info. Is that something your side doesn't want to show? This is also a question McCarthy (EPA director) would not answer in a congressional hearing in 2015. I'll say 10, you say 30, I'll meet ya in the middle at 20% man contribution to total CO2 and re figure. Carbon dioxide is 3.6 percent of total greenhouse gas. 3.6 x .2 = 0.72% of all heat trapping greenhouse gas is man made. 0.85 degree rise in 100 years, .85 x 0.72% If CO2 is to blame, then so be it. You win. Mans contribution to global warming over the last 100 years is 0.006 C. More KoolAid? Radiation will not penetrate a perfect insulator, thus as I said space is not a perfect insulator.- Swan |
| 31-01-2017 19:41 | |
| spot★★★★☆ (1323) |
Your a super-genius!!!! just what this forum needs another one! You have single-handily proven generally accepted scientific thought about the atmosphere since Tyndall wrong with a few basic sums! All that time mowing those lawns was wasted! Oh and is this link an Alarmist link?https://archive.org/details/contributionsto01tyndgoog |
| 31-01-2017 20:12 | |
| Surface Detail★★★★☆ (1673) |
GasGuzzler wrote: Meet you in the middle? On a matter of simple arithmetic? Seriously? If there are 405 ppm now, and there were 275 ppm before industrialisation, that means that humans have emitted 405 - 275 = 130 ppm. This is 32% of 405 ppm. Surely this is elementary level math! The reason you don't find it quoted is because it is not only blindingly obvious to anyone with the ability to do basic sums, but also not particularly relevant to the discussion. What we are interested in is the increase in CO2 over the last 150 years, for which humans are about 100% responsible. This is what has contributed to the increase in temperature over this period. |
| 31-01-2017 21:10 | |
| GasGuzzler★★★★★ (2933) |
What you are interested in is the increase. I am interested is why we are freiking out over a tiny increase in global temps when man input is microscopic. I'm just pokin and prodding to try and figure out what is that triggers the hysteria in your head. If it's so blindly obvious, then post up your sources. Mans percentage of total CO2 is not relevant to the discussion only because you don't want it to be. Why would you want to talk about the 99.#$**!!% of heat trapping greenhouse gas that is natural? You know, the vast majority player that even NOAA admits they know very little about. Oh gosh no, that'd be stupid. |
| 31-01-2017 21:23 | |
| spot★★★★☆ (1323) |
275 to 405 is microscopic? IBdaMann wrote: "Air" is not a body in and of itself. Ergo it is not a blackbody. Planck's law describes the spectral density of electromagnetic radiation emitted by a black body in thermal equilibrium at a given temperature T. |
| 31-01-2017 21:34 | |
| GasGuzzler★★★★★ (2933) |
why is 275 your baseline? |
| 31-01-2017 21:39 | |
| spot★★★★☆ (1323) |
If you have really spent as much time studying this as you claim you would know its the pre-industrial baseline. It's the frigging basics. |
| 31-01-2017 21:53 | |
| litesong★★★★★ (2297) |
spot wrote:If you have really spent as much time studying this as you claim you would know its the pre-industrial baseline. "old sick silly sleepy sleazy slimy steenkin' filthy vile reprobate rooting (& rotting) racist pukey proud pig AGW denier liar whiner gasguzlr & gazmuflr" is gassing you on. Its in its name, as are the many other accurate terms. Its name is SOOO accurate, it LIKES its name. He understands AND knows the numbers, but he denies you, as is its habit. |
| 31-01-2017 22:06 | |
| Tim the plumber★★★★☆ (1356) |
spot wrote: I think it's more that 130 parts per million is microscopic. This is a reasonable position. That said, GasGuzzeler, don't bother with this argument. You don't know the science, that nobody knows it is a different point that they will never need to concead because they are religious in their thinking and as long as there are some scientists who say that they understand it the alarmist will be happy in their belief. The point to attack is the impact of the increased CO2. Using the numbers supplied by the IPCC. I know that these are massively overblown but bear with me... The worst case scenario is that the world will be slightly warmer and nicer. Any negative impacts of the element of life being more abundant are microscopic and mostly just not there. The temperature difference between now and 2100, max increase, is less than the difference in a slightly colder year and a normal year, whatever that is. |
| 31-01-2017 22:10 | |
| GasGuzzler★★★★★ (2933) |
spot wrote: Radiation will not penetrate a perfect insulator, thus as I said space is not a perfect insulator.- Swan |
| 31-01-2017 22:19 | |
| GasGuzzler★★★★★ (2933) |
spot wrote: Ha Ha! This is funny, got an email on my phone about a construction project budget, and promptly typed in my response right here. Ooops! (new home 275K) The answer does make me look like quite the baffoon! Yes Tim, that is the angle I'm trying to swerve into, just can't get there. I'm not denying increased CO2, I'm saying that mans actual contribution to any actual warming is microscopic. There are those on here that would shut down the entire global economy (oil) for one degree. The thermostat in your home is + - 1 degree! (but tens of millions are already dead!) Like Tim said, just a nicer day for some. Radiation will not penetrate a perfect insulator, thus as I said space is not a perfect insulator.- Swan Edited on 31-01-2017 22:22 |
| 31-01-2017 23:19 | |
| Surface Detail★★★★☆ (1673) |
GasGuzzler wrote: You've been claiming that mankind's contribution to the amount of CO2 in the atmosphere is tiny, 3.2% being one of the various figures you quoted. These figures are simply wrong; someone has been lying to you. This graph, based on the composition of tiny bubbles of air trapped in the Antarctic ice, shows how the CO2 concentration of the atmosphere has evolved over the past 2,000 years:  It is taken from this page of the CSIRO website: http://www.csiro.au/greenhouse-gases/ It is very obvious that industrialisation has resulted in a dramatic and continuing increase in the concentration of CO2 in the air (from about 275 ppm to, now, 405 ppm) of about 47%, meaning that humans are responsible for about 32% of the CO2 in the atmosphere. Perhaps you could let us know where you got the 3.2% figure from, so that we can point our fingers and laugh at the lying scumbags. Edited on 31-01-2017 23:21 |
| 01-02-2017 00:15 | |
| GasGuzzler★★★★★ (2933) |
Laugh at the lying scumbags? There's ten million dead people from AGW. No laughing matter. [img][/img] Radiation will not penetrate a perfect insulator, thus as I said space is not a perfect insulator.- Swan Attached image: 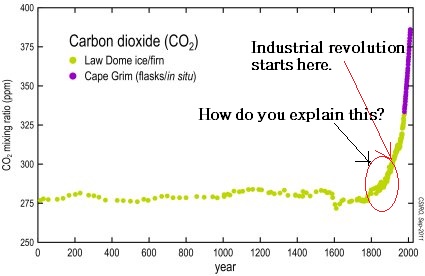 |
| 01-02-2017 00:31 | |
| spot★★★★☆ (1323) |
When do you think the industrial revolution started? |
| 01-02-2017 00:44 | |
| GasGuzzler★★★★★ (2933) |
There was a slow steady increase in global fossil fuel usage until 1950 when it spiked hard and never looked back. The above chart shows the hard spike at 1850 (or earlier), 100 years previous. Why? [img][/img] Radiation will not penetrate a perfect insulator, thus as I said space is not a perfect insulator.- Swan Attached image: 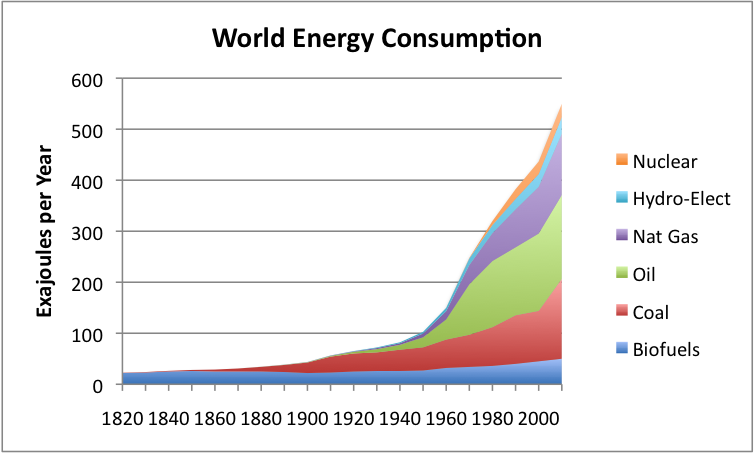
Edited on 01-02-2017 00:45 |
| 01-02-2017 00:52 | |
| GasGuzzler★★★★★ (2933) |
Is this clearer? [img][/img] Radiation will not penetrate a perfect insulator, thus as I said space is not a perfect insulator.- Swan Attached image: 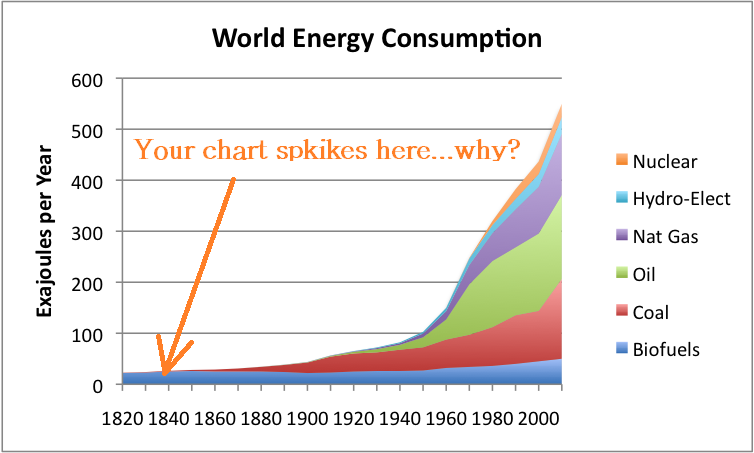 |
| 01-02-2017 00:57 | |
| spot★★★★☆ (1323) |
I don't really understand how all this is so confusing to you, unless of course you are being deliberately obtuse. The reason CO2 started to increase at that time is because there were fossil fuels used at that time. It was the hallmark of industrial period, before that fossil fuels were hardly used. I don't know if you did history but there were railways and steam ships and factories at that time. Coal when burned gives off CO2. If you have a better explanation as to why CO2 levels started to rise at that time I am sure we would all love to here it. |
| 01-02-2017 01:11 | |
| GasGuzzler★★★★★ (2933) |
How do you not see it????? The spike in CO2 is clearly 100+years before the spike in fossil fuel usage. [img][/img] Radiation will not penetrate a perfect insulator, thus as I said space is not a perfect insulator.- Swan Attached image:  |
| 01-02-2017 01:12 | |
| GasGuzzler★★★★★ (2933) |
...and this. [img][/img] Radiation will not penetrate a perfect insulator, thus as I said space is not a perfect insulator.- Swan Attached image:  |
| 01-02-2017 01:19 | |
| spot★★★★☆ (1323) |
I'm not going to argue with you, I'm not going to argue that the total amount of CO2 emitted per year was small compared to now. I'm saying that it was large enough to be detectable in what records we have. You are the one who thinks that factories locomotives and steam ships did not impact the record, I'm asking if not what did? |
| 01-02-2017 01:46 | |
| Surface Detail★★★★☆ (1673) |
GasGuzzler wrote: Do you understand that the CO2 curve is cumulative, while the energy consumption curve (as a proxy for CO2 released) is year-by-year? Hence you wouldn't expect the curve shapes to match. If, for example, the energy consumption curve were flat, then the CO2 curve would be a constant upward slope. The CO2 curve should be the integral of the energy consumption curve. |
| 01-02-2017 08:14 | |
| litesong★★★★★ (2297) |
litesong wrote:The western warm component has thickened at its northeast end north of eastern Siberia, extending toward the North Pole. The warmth that spans from Scandinavia to western Siberia, appears to extend toward the North Pole region, too. But so far, the Present High Arctic Berserker or PHAB or FAB appears NOT to be strengthened. The cold front that was pushed off the Greenland Ice Sheet continues on the north & east shores of Greenland, & seems to moderate the two warm fronts from securing solid footing on the High Arctic. Due to the smaller size(altho intense) of the cold front, average temperature in the Present High Arctic Berserker or PHAB or FAB has risen from 4degC to 7degC over-temperature. Because the 20degC over-temperature warm front that was on Canada last week split, moving to Arctic Canadian Islands, Greenland AND towards the North Pole, cold is setting in on the Maple Leaf lower latitudes. The major cold front that was on Alaska & later moved to eastern Siberia, is now residing in mid-northern Siberia. |
| 01-02-2017 22:24 | |
| Tim the plumber★★★★☆ (1356) |
GasGuzzler wrote:spot wrote: I know that you will have been told that tens of millions are already dead by idiot alarmists but when challenged there is no evidence what so ever of any problem what so ever at all so far. |
| 01-02-2017 22:29 | |
| Tim the plumber★★★★☆ (1356) |
spot wrote: The graph you are talking about shows an increase in CO2 from 1800. Given that the use of fossil fuels in any sort of significant quantity did not happen untill much later the increase in CO2 cannot be due to fossil fuels in 1810. Land use changes may accout for it but I struggle to think of any such at the time. The forrests of central Europe and North America's Eastern sea board were not being chopped down dramatically untill later as well. Where has this graph come from? |
| 02-02-2017 00:06 | |
| Wake★★★★★ (4034) |
What is a hell of a lot more important than specifics is that the Global Warmists have hijacked the entire subject and you are forbidden to question them. Even when they have NO scientific credentials or training - Can you imagine AL GORE, a half azzed politician riding shotgun on this subject? Most of us that have worked in science as I have for the last 40 years know that you cannot get 10 scientists in a room that would agree what the wavelength of "red" is. And yet we are continuously bombarded by this preposterous 97% number. Apparently your opinion doesn't count unless you are a "climate scientist" (who are self identified for the most part) and you cannot be a "climate scientist" unless you agree with the mantra. |
| 02-02-2017 00:49 | |
| Wake★★★★★ (4034) |
climate scientist wrote: Some questions if I might? This is a discussion and not an argument: Why would you even mention the temperature of a single year when it is within the normal variations of temperature? The very idea of an "average temperature" is the combination of many years temperature records. The earth is still recovering from not just the last ice age but the little ice age. Would you dare to use the Dalton Minimum as proof of a coming ice age when people were ice skating on the Thames River in London? We know that the weather patterns are not stable and you appear to be saying that they should be. Since this is one of the coldest periods in the last 100 million years why wouldn't you normally expect the Earth to rewarm? CO2 is formed with the combination of atmospheric oxygen with any number of sources of carbon including an extremely small portion produced by fossil fuels. The overwhelming majority of this CO2 is being added to the atmosphere by boiling out of the oceans with the perfectly normal heating which began in 1886. But since this CO2 has a lower latent heat content than the O2 it replaces exactly how does this work in your opinion that CO2 could possibly have a heating effect on the atmosphere and not the reverse? After all, spectroscopy shows that CO2's absorption spectra is below the emission bands of the Sun and above the emission bands of the Earth. |
| 02-02-2017 02:29 | |
| Surface Detail★★★★☆ (1673) |
Wake wrote: You clearly have a lot to learn. You could start by googling "ice age". |
| 02-02-2017 03:28 | |
| Wake★★★★★ (4034) |
You clearly have a lot to learn. You could start by googling "ice age". You are perfectly welcome to teach me. But that doesn't mean you referring me to something you don't understand in the first place. |
| 02-02-2017 19:57 | |
| litesong★★★★★ (2297) |
litesong wrote: I had predicted that FAB could reach 150 straight days of over-temperatures. Well..... if NOT for one questionable day, FAB would now be 153 straight days long. With that one day in consideration, the FAB is still 138 straight days long. While FAB has been idling at 4degC over average temperatures to 7degC presently, the FAB extended its life to 143 straight days long. Except for one questionable day, FAB would be 158 straight days AND would be the longest period of over warm High Arctic temperatures in the satellite records. It does appear the life of FAB is about to be, if not already, 150+ straight days. Two(?) months ago I suggested that FAB may extend to 200 straight days, by far, longer than any High Arctic time period in the satellite record. THAT possibility is still in play. ALSO, the possibility of the FAB extending WELL(?) BEYOND 200 straight days is on the table. |
| 02-02-2017 20:19 | |
| spot★★★★☆ (1323) |
Wake wrote:You clearly have a lot to learn. You could start by googling "ice age". If reading is too hard their are films; https://www.youtube.com/watch?v=cMfeWyVBidk But seriously ice ages are a well known thing, You clearly have a lot of time on your hands I'm at a loss as to what your trying to prove. IBdaMann wrote: "Air" is not a body in and of itself. Ergo it is not a blackbody. Planck's law describes the spectral density of electromagnetic radiation emitted by a black body in thermal equilibrium at a given temperature T. |
| 03-02-2017 02:37 | |
| litesong★★★★★ (2297) |
litesong wrote: so far, the Present High Arctic Berserker or PHAB or FAB appears NOT to be strengthened. The powerful cold & warm fronts seem to have kept each other at bay, from taking over the North Pole & High Arctic recently, 'cept da FAB presently is 7degC over temperature. However, the cold front, that used to be on the Greenland Ice Sheets & has now moved off the Ice Sheets to northern & eastern Greenland shorelines, appears to be doing something weird. The cold front has bored a 300 mile(?) long, 100 mile(?) wide cold passage THOUGH a warm front approximately towards the North Pole. THAT is interesting!! |
| 03-02-2017 07:13 | |
| litesong★★★★★ (2297) |
Glaciers around the world: http://climatenewsnetwork.net/climate-link-glacier-retreat-irrefutable/ From the article: The scientists studied the pattern of behaviour of 37 glaciers spread around the globe, in Austria, in Washington State in the US, in New Zealand, in Sweden and so on, and matched them with local meteorological trends. But the retreat of the world's glaciers – their terminals now compared with where they ended many decades ago – is well documented in paintings, photographs and alpine records....glacial retreat is one of the purest signals of climate change yet measured by statistical techniques: it could be seen at work in 36 of the 37 cases. Edited on 03-02-2017 07:20 |
| 03-02-2017 07:23 | |
| litesong★★★★★ (2297) |
litesong wrote:.... THOUGH a warm front approximately towards the North Pole. Correction: .... THROUGH a warm front approximately towards the North Pole. |
| 03-02-2017 14:35 | |
| litesong★★★★★ (2297) |
litesong wrote: The cold front has bored a 300 mile(?) long, 100 mile(?) wide cold passage THROUGH a warm front approximately towards the North Pole. The small cold front boring is being smeared away by a warming front nearly on the North Pole..... BBBUUUUTTTT, a more concerted effort by the north & east Greenland shore cold front towards the North Pole may develop. For years I've been interested in the average High Arctic temperature profile that has developed since satellite observations began. As the years of satellite data has built up, the yearly HA temperature average is a progression of consistent & fairly smooth daily transitions in the profile, very strongly determined by the solar energy impinging on the Arctic at different angles..... or NOT impinging on the Arctic when the sun is below the horizon. However, even when averaged over a half century+ of data, small, but definite drops of a few degC temperature do occur in the profile at specific times of the year. And this is the period of yearly time, that the roughest portions of the temperature profile occur. I wonder if the cold front developed on the Greenland Ice Sheet tends to slide off the Ice Sheet TOWARDS the North Pole around this time of year, as it has done this year? That mechanism could explain the dips on the High Arctic temperature profile. Edited on 03-02-2017 14:38 |
| 03-02-2017 19:38 | |
| Wake★★★★★ (4034) |
litesong wrote:litesong wrote: The warm western component now is on the U.S. Dakotas & Montana, & extends northwest, increasing powerfully in Canada, Yukon, northern Alaska, & onto the southern Arctic Ocean north of Alaska & eastern Siberia.....The eastern warm component has shifted to northeastern Canada, & onto the Davis Strait, & southern Greenland, chasing the Greenland Ice Sheet cold front to the shores of North & East Greenland shores, the Greenland Sea, Svalbard & Iceland. Forecasts indicate the FAB & the previous Ice Sheet cold should continue to battle. Some warmth from the south may take over one footing of the cold on Iceland. At what point does the melting Greenland glaciers revealing that there were farms beneath where the glaciers are melting strike any sort of note of question in your mind? |
Join the debate Arctic waters not freezing:
Related content
| Threads | Replies | Last post |
| Arctic sea ice cover | 19 | 09-04-2022 08:29 |
| Arctic ice cover | 2 | 02-04-2022 09:26 |
| Polar vortex regains it's shape and position over the Arctic Video!!! | 5 | 01-06-2021 06:54 |
| Is Western Arctic Warming related to Magnetic Pole Movement? | 8 | 17-03-2020 03:59 |
| Warm Waters | 20 | 23-12-2019 22:20 |