Hurricanes Worldwide 1970-2012
| Hurricanes Worldwide 1970-201217-12-2012 21:35 | |
| kfl☆☆☆☆☆ (36) |
Hurricanes Worldwide 1970-2012 Based on data from Maue, RN (2011): Global Frequency. I have studied the development of the number of tropical cyclones during the years January 1970 through September 2012 divided into the Northern and Southern Hemisphere. I would like to thank R.N. Maue for collecting data on tropical cyclones and making data public. I have not done a quality control of the data and have used data as they are. I am using "tropical cyclones" as a generic term for tropical storms of different strengths and 1970-2012 as label for the period January 1970 through September 2012. This analysis might be looked upon as complementary to what can be found at PoliClimate. It will probably not add very much to the scientific understanding however, it has given me more insight in the development of the number of tropical storms and may be of interest to some bloggers too. IPCC expects over the next 100 years fewer tropical cyclones and the strongest hurricane will be even stronger. This means using the terminology below, that the IPCC expects fewer Tropical Storms and more Major Hurricanes. Hot seawater will make the tropical cyclones stronger – hot seawater is the fuel for tropical cyclones. For the time being it is unclear to me why the number of tropical cyclones is expected to decrease. IPCC has written the following in AR4: Has there been at Change in Extreme Events like Heat Waves, Droughts, Floods and Hurricanes?
From Knudson et al, MIT: Tropical Cyclones and Climate Change I have copied a section of the summary:
The question is whether this can be verified from data for the years 1970-2012? This is going to be answered in the following. The following classification of tropical cyclones has been used: 1. Tropical Storm, i.e. wind speed from 34 knots (17.5 m/s) to 64 knots (33 m/s) 2. Hurricane, i.e. wind speed from 64 (33 m/s) to 96 knots (50 m/s) 3. Major Hurricane, i.e. wind speed more than 96 knots (50 m/s) The Globe has been divided as follows: 1. The Northern Hemisphere 2. The Southern Hemisphere Summary 1. There has been a significant increase in the number of Major Hurricanes in both the Southern and Northern Hemispheres. During the years 1970 to 2011 the annual number of Major Hurricanes has grown by approx. 40%. 2. There has been a small but not significant decrease in the number of tropical storms. In the Southern Hemisphere, the annual number of tropical storms has decreased by approx. 30%. 3. Within the Northern and Southern Hemisphere there is a positive correlation between the number of Tropical Storms, Hurricanes and Major Hurricanes. 4. The distribution between Tropical Storms, Hurricanes and Major Hurricanes is same in the Northern and Southern Hemispheres. 5. It is obvious that the number of tropical cyclones does not show a direct correlation to global warming, but through some cryptic mechanisms. 6. There is a bias in the information about tropical cyclone, i.e. it is US centric. Only 12.6 % of the tropical cyclones are affecting the Atlantic, but we hear a lot about them compared with other areas. Broadly speaking, this analysis confirms the IPCC predictions retrospectively for the period 1970-2012. What would happen in the future is open for discussion. This analysis will hopefully lead to a more informative discussion about global warming and development of the number of tropical cyclones. I was surprised to find these results, since it has been a recurring theme in the climate debate that the IPCC was wrong in terms of the development of the number of tropical cyclones. Overview The analysis includes a total of 6690 tropical cyclones, of which the number of Tropical Storms, Hurricanes and Major Hurricanes are respectively 3723, 2025 and 942 representing 56%, 30% and 14%. The average number per year of Tropical Storms, Hurricanes and Major Hurricanes are respectively 87, 47 and 22. The analysis of the Northern Hemisphere includes 4555 tropical cyclones, of which the number of Tropical storms, Hurricanes and Major Hurricanes are respectively 2488, 1405 and 662 representing 55%, 31% and 14%. The average number per year of Tropical Storms, Hurricanes and Major Hurricanes are respectively 58, 33 and 15. The analysis of the Southern Hemisphere includes 2134 tropical cyclones, of which the number of Tropical Storms, Hurricanes and Major Hurricanes are respectively 1235, 619 and 280 representing 58%, 29% and 13%. The average number per year of Tropical Storms, Hurricanes and Major Hurricanes are respectively 29, 14 and 7. The distribution between Tropical Storms, Hurricanes and Major Hurricanes in the Northern Hemisphere and Southern Hemisphere does not differ significantly from each other. The number of tropical cyclones in the north and south is significantly different. In total the number of tropical cyclones in the Southern Hemisphere makes up 32% of the total number of tropical cyclones. The tropical cyclones prone area in the Southern Hemisphere makes up 42% of the total tropical cyclones prone area. This number is found by counting 5 * 5 degree squares on the map page 505 Marine Safety Information Chapter 35 Tropical Cyclones where tropical cyclones occur. As a first guess this is probably OK to do so. The number of tropical cyclones in the Southern Hemisphere, calculated in proportion to tropical cyclone prone area, equals 0.42*6690= 2803. The actual number is 2134. This is significantly lower. Here is another map of the tracks of tropical cyclones worldwide: 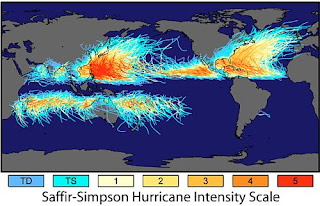 This leads to the following questions: 1) Why is the tropical cyclones prone area smaller in the Southern Hemisphere than in the Northern Hemisphere? 2) Why is the number of tropical cyclones in the Southern Hemisphere relatively smaller than the in the Northern Hemisphere? The following graphs show the number of tropical cyclones globally, in the Northern Hemisphere and in the Southern Hemisphere per year:  Visually, only the number of Major Hurricanes is significantly growing in the Northern Hemisphere, while the Tropical Storms are significantly decreasing. The number of Major Hurricanes is significantly growing in the Southern Hemisphere. If you look at a shorter time span than 43 years, other observations could be made. For the years 2009-2012 the number of tropical cyclones is smaller than expected. However, 4 years are a too few years to put forwards a statement on a general trend. Please be aware that 2012 only includes 9 month so far. There is an apparent difference in the development of the number of tropical cyclones in the Northern and Southern Hemispheres. Distribution of tropical cyclones by month As far I know, there is nothing in the theory of global warming to indicate a change in the distribution of tropical cyclones by month. However, I have investigated this by using a chisq-test. There has not been found any significant differences in the distribution of the number of tropical cyclones by month in the Northern and Southern Hemispheres respectively. This applies to Tropical Storms, Hurricane and Major Hurricane as well. There is a remarkable difference in the distribution by month between The Northern and Southern Hemisphere. The following graphs are showing the frequency of Major Hurricanes for the Northern and Southern Hemisphere, where the months are shifted to show season, not calendar year:  The number of Major Hurricanes for the Northern Hemisphere shows a left skew distribution with a gradually decreasing trend after the peak at the month of September, while the number of Major Hurricanes for the Southern Hemisphere shows a more abrupt decreasing trend after the peak at the month of March. The tropical cyclone season is 12 months for the Northern Hemisphere and 9 months for the Southern Hemisphere. Why this difference? My analysis could have stopped now, but in order to test the validity of the conclusions, the analysis is also performed with monthly data, reaching almost the same conclusions. Cyclic variation Due to the seasonal shift between the Northern and Southern Hemisphere a cyclic variation in the number of tropical cyclones is expected. The frequency is shifted 6 months between the two hemispheres. This is pointing at cycles of 6 and 12 months respectively and can be seen in the following graphs.  The above information is used in estimating the development of the number of cyclones. Trends in numbers of tropical cyclones The trend in numbers of tropical cyclones is examined using a generalized linear model with Poisson variation, i.e. a linear regression plus two harmonic cycles of 12 and 6 months' periods. A surprisingly good fit is achieved for all classes of tropical cyclones within each hemisphere. However, the fit is not so good when you look at the global figures for each class of tropical cyclones. An alternative model has been tested with almost the same results. This model is the same as the above where the harmonic terms have been replaced by the empirical frequency distribution on month of the number of tropical cyclones for each class. Tropical storms Developments in the number of tropical storms during the years 1970-2012 for the Northern Hemisphere are shown in the graph below, but due to lack of space only shown for 2000-2012.  There is no significant trend in the annual number of Tropical Storms and the expected number is approx. 58. The model can explain 86% of the total variation and the expected number of tropical storms is shown in the graph below. The development in the number of Tropical Storms during the years 1970-2012 for the Southern Hemisphere can be seen in the following graph showing a decreasing trend.  The model explains 80% of the total variation. From 1970 to 2011 the expected number of Tropical Storms per year went down from approx. 35 to approx. 24. The development in the number of Tropical Storms during the years 1970-2012 for the whole planet is shown in the following graph, but due to lack of space only shown for 2000-2012.  The variation originates from merging the figures from the Northern and Southern Hemisphere, each with its own cyclic variations. The model explains 65% of the total variation. There is no significant trend and approx. 87 Tropical Storms are expected annually. Although there is a decreasing trend in the number of Tropical Storms in the Southern Hemisphere, it is not reflected in the total level. Hurricanes The development in the number of Hurricanes in the Northern Hemisphere during the years 1970-2012 is shown in the graph, but due to lack space only shown for 2000-2012  The model explains approx. 79% of the total variation. There is no significant trend. There is expected approx. 33 Hurricanes per year. The development in the number of hurricanes in the Southern Hemisphere during the years 1970-2012 is shown in the graph, but due to lack of space only shown for 2000-2012.  The model explains 68% of the total variation. There is no significant trend. There is expected approx. 15 Hurricanes per year. The development in the number of Hurricanes for the entire globe during the years 1970-2012 is shown in the following graph, but due to lack of only shown for 2000-2012.  The variation originates from merging the figures from the Northern and Southern Hemisphere, each with its own cyclic variations. The model explains 58% of the total variation. There is no significant trend. There is expected approx. 47 Hurricanes per year. Major Hurricanes The development in the number of Major Hurricanes during the years 1970-2012 for the Northern Hemisphere is shown in the graph below, but due to lack of space only shown for 2000-2012.  The model explains 64% of the total variation. There is a significant growing trend in the number of Major Hurricanes during the years 1970-2012. The expected number increased from approx. 14 to approx. 18 per year. The development in the number of Major Hurricanes during the years 1970-2012 for the Southern Hemisphere is shown in the graph.  The model explains 47% of the total variation. There is a significant growing trend in the number of Major Hurricanes during the years 1970 -2012. The expected number has grown from approx. 5 to approx. 8 per year. The development in the number of Major Hurricanes during the years 1970-2012 for the entire globe is shown in the graph.  The variation originates from merging the figures from the Northern and Southern Hemisphere, each with its own cyclic variations. The model explains 38% of the total variation. There is a significant increasing trend in the number of Major Hurricanes. The expected number of Major Hurricanes has increased from approx. 18 per year in 1970 to approx. 26 per year in 2011, representing an increase of approx. 8 per year or an increase of approx. 40%. The reduction in explained variation doing the analysis for all Major Hurricanes together, indicates that the model has not caught all variations. Correlations As expected there is a correlation between each hemisphere of Tropical Storms, Hurricanes and Major Hurricanes.  The negative correlations between the Northern and Southern Hemispheres are caused by the seasonal shift between the two hemispheres. Number of tropical cyclones and global warming? The big question is whether the observed trends in number of tropical cyclones are caused by the global warming or whether there is some mechanism that causes a cyclic variation longer than 1 year. However, the span of years 1970 to 2012 is not long enough to answer these questions and therefore the answer must be sought in the theory of global warming. It is also surprising that there is a different development in the Northern and Southern Hemispheres and in the number of cyclones. It will be interesting to hear / to find an explanation for this. As a result of the dominance of US based news media worldwide, the information about the tropical cyclones in the Atlantic region is more dominant than from the other parts of the world. This can lead to an incorrect understanding of trends and causes, since the number of tropical cyclones in the Atlantic region accounts for only 12.6% of the total number of tropical cyclones. The Atlantic Tropical Storms, Hurricanes and Major Hurricanes accounts only for 13.1 %, 12.7 % and 10.8 % of the total number of Tropical Storms, Hurricanes and Major Hurricanes respectively. This blog post is subject to the writer's right to update, when errors and misunderstandings are discovered or new knowledge emerges. |
| 19-12-2012 15:03 | |
| Tim the plumber★★★★☆ (1356) |
Erm.. very impressive but erm..... I am right in thinking it shows a decrease in storms in general? |
| 19-12-2012 16:33 | |
| kfl☆☆☆☆☆ (36) |
Hi Tim That's correct. There are two trends: 1) Fewer Tropical Cycklones 2) Some of them get worse. |
| 08-01-2013 17:01 | |
| Daniel☆☆☆☆☆ (9) |
Kfl and Tim, Data shows that an increase in SST will lead to an increase in hurricanes (and major hurricanes), but there is a limiting factor. This research shows that increases above 28.25C, have no relation to hurricane strength. After that, other factors take precedence. http://www.worldclimatereport.com/index.php/2006/05/10/major-hurricanes-more-but-not-stronger/ |
| 09-01-2013 23:00 | |
| Tim the plumber★★★★☆ (1356) |
The ultimate intensity that a storm achieves is less dependent on the underlying SST than it is on a myriad other environmental factors, such as vertical wind shear and atmospheric stability—which that are less clearly related to anthropogenic greenhouse-related changes than is SST. Our results call into question how significantly future global warming will impact Atlantic tropical cyclones and whether or not such an impact is currently detectable. The rest is a bit beyond me. Am I right in thinking that it translates into; "the hype is overblown, in reality it's nothing significant, don't lose sleep over this even if it's real which is doubtful..." |
| 10-01-2013 14:09 | |
| Daniel☆☆☆☆☆ (9) |
Tim, Basically, yes. Several other hurricane experts have echoed the same response. The hype began in 2005 when Katrina (and a host of other strong storms) hit the US. Al Gore makes mention of this in his movie. Since then, hurricanes have been in decline worldwide, as the worl of Ryan Mauer shows (previously linked). |
| 10-01-2013 15:38 | |
| kfl☆☆☆☆☆ (36) |
Hi Daniel,Tim The paper by Ryan Maue does not give the full picture. We know, that there is an increase in the frequency of Major Hurricanes due to increasing SST. This has been confirmed by other scientists several time. |
| 01-02-2013 16:41 | |
| Daniel☆☆☆☆☆ (9) |
kfl, Be careful about stating what we think we know. The following graphs show that the number of major hurricanses has not increased with increasing SST. Also, temporary increases in one region have been offset by decreases in others. http://www.mitosyfraudes.org/images-21/hurricane_frequency.png http://www.worldclimatereport.com/wp-images/boyer_fig2.JPG http://www.cpc.ncep.noaa.gov/products/outlooks/hurricane2004/August/figure4.gif http://www.gfdl.noaa.gov/pix/user_images/miz/c180_ts_all2.png The following graph compares hurricane intensity with SST. Notice that the number of storms increases as the temperatures increases, but after a certain point, there is no effect. Whether a storm becomes a major hurricane is more dependent on atmospheric conditions than water temperature. http://www.worldclimatereport.com/wp-images/GRL_hurricanes_fig3.JPG |
| Repost of Daniel's post01-02-2013 18:49 | |
| kfl☆☆☆☆☆ (36) |
kfl, Be careful about stating what we think we know. The following graphs show that the number of major hurricanses has not increased with increasing SST. Also, temporary increases in one region have been offset by decreases in others.     The following graph compares hurricane intensity with SST. Notice that the number of storms increases as the temperatures increases, but after a certain point, there is no effect. Whether a storm becomes a major hurricane is more dependent on atmospheric conditions than water temperature. 
Edited on 01-02-2013 18:50 |
| 01-02-2013 19:00 | |
| kfl☆☆☆☆☆ (36) |
Hej Daniel Many thanks your post. I will try to come back with at reply. I have written a blogpost in danish about Atlantic Tropical Cyclones: Atlantic Hurricanes Hopefully you can read the graphs. |
| 01-02-2013 19:08 | |
| Daniel☆☆☆☆☆ (9) |
kfl, I was able to comprehend the graphs sufficiently. This appears similar to other research; that an increase in SST leads to an increase in the number of storms, but not storm intensity. Unfortunately, the number of storms in earlier periods is compromised by detection ability. This occurs only in the tropical storm portion, where storms could have generated and remained far out to sea. Major hurricanes are most likely to be recorded, due to size and occurrance closer to land and/or shipping lanes. |
Join the debate Hurricanes Worldwide 1970-2012:
Related content
| Threads | Replies | Last post |
| Coal use climbs worldwide despite promises to slash it | 1 | 06-04-2023 08:21 |
| hurricanes and cyclones | 36 | 03-03-2021 20:56 |
| Climate protesters block Burrard Street Bridge in Vancouver amid worldwide demonstrations | 0 | 07-10-2019 23:11 |
| This is how our changing climate could increase the risk we face from hurricanes | 0 | 27-03-2019 15:54 |
| Climate strikes spread worldwide as students call for action | 2 | 16-03-2019 17:31 |