Earthquakes
| Earthquakes14-03-2018 05:10 | |
| BarnabyJones☆☆☆☆☆ (6) |
There is supposedly some settled science somewhere that shows how much warming is caused by how much carbon dioxide in the atmosphere. Where is it? If the science is settled on this issue why did the computer models fail by a margin that suggests they are useless? I have heard that all of the green house radiation is absorbed within about ten feet from the earth. But somehow there is additional warming caused by adding more carbon dioxide and the science is settled on that too? And all climate scientists must be experts in the quantum physics of carbon dioxide in atmosphere. Quantum physicists will be the first to suggest that noone understands quantum physics including themselves. But the science is settled on global warming and almost all scientists agree according to most of the media. The argument sounds like a shouting match between drunks much of the time. The endless confusion and noise over the .002 percent of the atmosphere that is manmade carbon dioxide suggests there might be something wrong with the so called settled science. Meanwhile there is very good evidence that suggests all of the warming is accounted for by seismic activity. Of hundreds of people I have asked, none has ever heard that there is a new magnitude rating system for earthquakes since the 1970's. The new rating system is based on the total amount of energy released by an earthquake and not on the amplitude of the seismic waves like the old Richter scale. Most of the energy released is said to be in the form of heat caused by the friction between the tectonic plates and the shearing off of rock. The earthquake energy formula gives the amount of energy released by an earthquake by plugging in the magnitude. As an example, the magnitude 9.2 earthquake in 2004 released as much heat as about 20 million one megaton hydrogen bombs. The fault was about 12 miles under the ocean floor and 1000 kilometers long. How is this not going to heat up the ocean and melt a lot of ice? It is just a coincidence that millions of square kilometers of Arctic sea ice melted away suddenly after this earthquake? One sees that the Arctic sea ice melts away proportional to earthquake energy all the way down the graph. And there is about the same time delay between seismic activity and the melting of the ice all the way down the graph. A graph of Arctic temperature is nearly identical to a graph of earthquake energy going back a hundred years. The same is true for a graph of tropical storm and hurricane intensity. And the same is true for the US temperature graph before it was carefully adjusted by climate scientists. Climate scientists say they had to adjust the temperature record because of the time of day of that thermometers were read back in the 1930's and 1940's. By cooling off that time period and warming temperatures from recent decades they turned a slight cooling trend into a warming trend. And by removing weather station data from rural and higher latitude and higher altitude locations in recent decades they have fabricated a fake media event called manmade global warming. The rural temperature record generally shows either pronounced cooling or no warming through the 1900's. Why would "scientists" do such a thing? Some say for political reasons or grant money. It is interesting that the data tampering started about the year 2000 right after the invention of weather futures at the Chicago Mercantile Exchange and as seismic activity was becoming highly elevated. One need only slide the earthquake energy graph to the right about two years to create a good approximation of the future temperature record. Investment bankers who spend millions of dollars on meteorologists would never become aware of such information? And all the billions lost by investment bankers in the nuclear industry might be recovered if the public could be scared sufficiently by global warming and billions more in bonus prizes trading carbon credits. But it is only the oil industry that might profit from disinformation about the climate. The fact that earthquakes are not at or near the top of the list of explanations for the warming suggests that much or most of the planet including the scientific community has been rendered near brain dead by the endless noise and confusion coming from the media. Www.globalcoolingcausesglobalwarming.blogspot.com |
| 14-03-2018 10:43 | |
| still learning★★☆☆☆ (244) |
BarnabyJones wrote: "There is......settled science....Where is it?..." How about a list of journals where scientists publish their work on climate? One quick search provided as a first entry (from 2008) http://www.eecg.utoronto.ca/~prall/climate/journals.html That list doesn't include Nature or Science or Proceedings of the National Academy of Sciences all of which sometimes include climate related articles. Scientists publish about their work in peer-reviewed journals. Some of that work gets reported on in mass-media by journalists, usually badly. If you want a textbook, try Principles of Planetary Climate by R Pierrehumbert, Cambridge University Press 2010. Amazon has it. There are others too. If you want a book that includes copies of many foundational research papers on the subject (dating back to 1824), try The Warming Papers (subtitled The Scientific Foundation for the Climate Change Forecast) edited by Archer and Pierrehumbert, Wiley-Blackwell 2011. Amazon has it too. A lot of science there. |
| 14-03-2018 15:12 | |
| Tim the plumber★★★★☆ (1356) |
Abstract The potency of carbon dioxide (CO2) as a greenhouse gas (PDF Download Available). Available from: https://www.researchgate.net/publication/274956207_The_potency_of_carbon_dioxide_CO2_as_a_greenhouse_gas [accessed Mar 14 2018]. This might help. Edited on 14-03-2018 15:12 |
| 15-03-2018 16:52 | |
| Wake★★★★★ (4034) |
BarnabyJones wrote: CO2 without a doubt has been rising. Historically we can discover through several means that over the last million years the levels of CO2 in the atmosphere have varied from a low of 180 ppm to a high of about 280 ppm. The geologic source for these numbers is from seashells buried in sediments on the sea floor. Or in other words this is about as reliable as burning incense and using the smoke to tell the future. I cannot find any references to the difference in oceanic CO2 concentrations vs. atmospheric concentrations but using plant stomata research suggests that there is approximately a 25% difference with the atmospheric levels higher. Another method that has been pioneered by the Russians and Brits is analyzing the air bubbles trapped in Antarctic ice cores of which we have a record from 4 or more sites. But I have been critical of these since I think that they too suffer from the air in these bubbles actually being contaminated by the amount of CO2 that is soluble in water. And these levels are so remarkably similar. For about 10,000 years before present until about 1890 the levels show 280 ppm. Our dependable atmospheric CO2 level measurements didn't come until 1960 or so and interestingly enough the levels measured at that time were 320 ppm and prior means of measuring were assumed to be reliable. But you will note that 280 ppm/320 ppm = 87.5% or near my estimation of the levels different between water and air. And this after a long drag of wind over ocean waters. In any case, I don't think we can question that CO2 has been rising but how much. And we are still stuck saying that it is a significant percentage. But we absolutely can say that this makes no difference in the atmosphere's ability to hold (or more accurately the ability to slow the egress) of the Sun's emissions that reach ground level. Why? Because the levels of energy of the proper spectrum of CO2 are already in or very near saturation at the present levels. Since the temperature records have been tampered with in a grossly negligent manner to politicize a viewpoint the ground records are worthless. The satellite records are available and have been kept clean and they show no significant warming in the last 38 years. And if the CO2 records are correct the atmospheric levels of CO2 have risen 25%. So as I predicted the addition of CO2 to the atmosphere made no measurable difference to the Mean Global Temperature. This therefore, lends at least some credence to your idea that there is global warming caused by Earthquakes so shall we inspect that idea? https://www.google.com/imgres?imgurl=http://www.johnstonsarchive.net/other/quakeenergy.gif&imgrefurl=http://www.johnstonsarchive.net/other/quake1.html&h=455&w=675&tbnid=MZku68M63lkDEM:&tbnh=141&tbnw=211&usg=__gVVwhliuD4nti9GLc5ZwUVcriH0%3D&vet=10ahUKEwiq5oestu7ZAhWYyIMKHdMKBhEQ9QEILTAA..i&docid=Q44Od5cZ8bAqUM&sa=X&ved=0ahUKEwiq5oestu7ZAhWYyIMKHdMKBhEQ9QEILTAA This is a chart of the world wide energy released by earthquakes. http://www.drroyspencer.com/wp-content/uploads/UAH_LT_1979_thru_March_2017_v6.jpg This is a satellite temperature measurement graph representative of MGT since 1979. The earthquake chart shows a period of low activity from between 1980 and 1990. And the satellite temperature chart likewise. The earthquake chart shows slow rise to a sharp peak in 2005. Whereas the satellite data shows neither the instant following with regard to earthquake data nor a delayed response that one could suggest. If we look at sunspot activity and compare it to the temperature: https://solarscience.msfc.nasa.gov/SunspotCycle.shtml There appears to be falling solar activity at the same time that we have a more or less stable temperature. Remember that coincidence in and of itself is not indicative of causation. Could there be a connection between earthquake heating, falling sunspot activity and stable temperatures? Personally I think not. I think that the Earth is going merrily on it's way as it always has and that the atmosphere is a hell of a lot more complex than our science is trying to pretend. We have the additional problem of partial and complete cloud coverage and in some cases long term cloudless skies such as over the heavy deserts of north Africa, south Africa and Chile. Here is a 17 year animation of the cloud coverage of the globe: https://earthobservatory.nasa.gov/GlobalMaps/view.php?d1=MODAL2_M_CLD_FR But looking at the rainfall and temperature of Chile it seems little different from California. So cloudlessness and partial cloudiness doesn't seem to effect the weather significantly either. I don't know about you but presently I am not likely to jump to any conclusions as to the effects of any of the claimed sources. I am more of the opinion that heating in the atmosphere is a simple case of energy in and energy out and that temperature curves of any area are controlled more by weather patterns and not any specific properties. I am far more likely to blame climate on a combination of the sunspot activity and the Milankovitch Cycles. And I should note that this is the same reasoning I have used for four years now. Edited on 15-03-2018 16:53 |
| 16-03-2018 09:30 | |
| BarnabyJones☆☆☆☆☆ (6) |
As far as data tampering, I see that the fabricated temperature graph is part of the site logo. If a falsehood is repeated many times many will probably believe it. I see that a link to my blog did not become a hyperlink for some reason. If the graph in that blog is just a coincidence then it is just a coincidence that every time I turn on the stove, the water in the teapot gets hot. Most of the seismic activity in the world is under or around the Pacific ocean. Heat tends to rise to the surface where the ice is. If the ice melts, less sunlight is reflected into space increasing the warming. "In 1999, the Chicago Mercantile Exchange (CME) took weather derivatives a step further and introduced exchange-traded weather futures and options on futures—the first products of their kind. ... Other European weather firms determine values for the European contracts.Mar 6, 2018" That movie 'The Sting' was also in Chicago. https://youtu.be/EmDQiL3UNj4 Attached image: 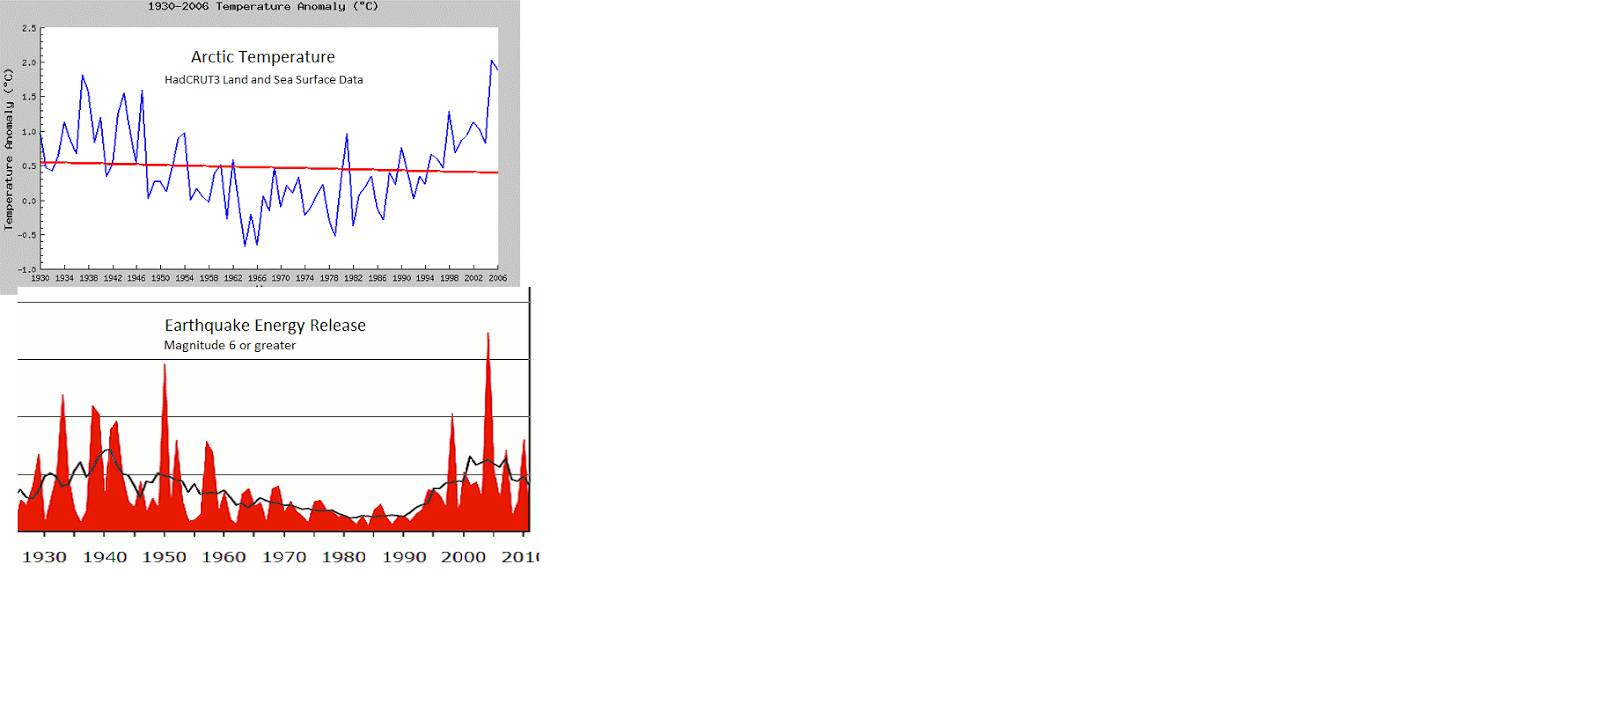 |
| RE: Commodities fraud16-03-2018 09:39 | |
| BarnabyJones☆☆☆☆☆ (6) |
https://www.nytimes.com/1989/01/30/business/fbi-commodities-sting-fast-money-secret-lives.html Vast fortunes can be made in the futures market in a very short time with a relatively small investment. Enterprising climate scientists msking a few adjustments to the temperature record could cash in big while congratulating themselves for cutting down on pollution and bankrupting the terrorist oil empire. Having a crystal ball to tell future temperatures with the earthquake energy graph would certainly be a big advantage. Attached image:  |
| 16-03-2018 17:50 | |
| Wake★★★★★ (4034) |
BarnabyJones wrote: Remember that I said that coincidence is not causation. The amount of energy generated by seismic activity each year (as measured over a 47 year period) can be calculated. Let's look up the numbers of earthquakes of the level 6.0 or larger that occur on the average each year: that is 286. Some 90% of the energy is released as heat and the rest absorbed in motion. MS Earthquakes per year 8.5 - 8.9 0.3 8.0 - 8.4 1.1 7.5 - 7.9 3.1 7.0 - 7.4 15 6.5 - 6.9 56 6.0 - 6.4 210 For every increase in magnitude by 1 unit, the associated seismic energy increases by about 32 times. This means that earthquakes below MS 6.0 can be pretty much discounted. Let's give every possible advantage to your theory and say that there are some 266 category 7 earthquakes each year, 18 category 8 and 1.5 category 9's. Studies from the International Polar Year (2007-2008) suggest that only about a quarter of them occur in the north polar regions. Rather than calculate the precise energy release let's just assume that each quake releases 1 x 10^19 joules which is on the high side. But using these numbers would also include volcanic additions as well. This give us (.25 x 288) x 10^19 joules = 72 x 10^19 joules. There are approximately 510 Trillion joules received from the Sun each second or 44 x 10^15 joules received each day and 16 x 10^21 each year. The Arctic region composes only 6% of the Earth whereas the heat from the Sun essentially is a world wide event. Seismic events are highly localized. This makes the heat of seismic activity under the most ridiculously absurd condition to be about 4.5% of the total heat. Remember that the heat from earthquakes is extremely localized and very rare whereas the energy from the Sun is in a continuous wave. I will leave it to your judgement as to whether heat generated by seismic events could cause measurable warming in the Arctic region. |
| 18-03-2018 10:48 | |
| BarnabyJones☆☆☆☆☆ (6) |
According to the earthquake energy formula at earthalabama.com, the total energy from a magnitude 9.2 earthquake is 7.78e22. The seismic wave energy is 3.98e18. There was enough heat energy from the 2004 earthquake to melt the Arctic sea ice in it's entirety. The magnitude 9.0 earthquake in Japan was in the middle of the north equatorial current that travels in the vicinity of currents going directly into the Arctic. Ocean currents in the vicinity of the 2004 Sumatra quake would also warm the North Equatorial current. The geology textbooks say the heat comes from the plates grinding together and the shearing off of rock. If one knows the approximate weight of the moving sections of the earth's crust and their velocity one could approximate the kinetic energy involved. If anyone has ever hit a rock with a hammer, they might notice how quickly the rock heats up. Earthquakes became a suspect to me as a source of warming because they violently disturb large volumes of water and perhaps thousands of cubic kilometers of seawater. The calorie was originally defined by dusturbing a tank of water with counter rotating paddles attached to a falling weight. The mass and distance the weight falls are a known quantity that is divided by the measured temperature increase. In his speaking appearances for which he is paid $300,000, Al Gore puts up a graph of global temperature going back thousands of years. On the same graph is the carbon dioxide level. The two plots look the same all the way down the graph. High school chemistry says that when a liquid is heated it holds less gas in solution. Mr. Gore's graph is exactly what one would expect as carbon dioxide in the oceans escapes into the atmosphere as temperature increases. Ice core studies have confirmed that the carbon dioxide graph is following the temperature graph. And so Al Gore won a Nobel prize for something that would not even pass a highschool chemistry test. Attached image: 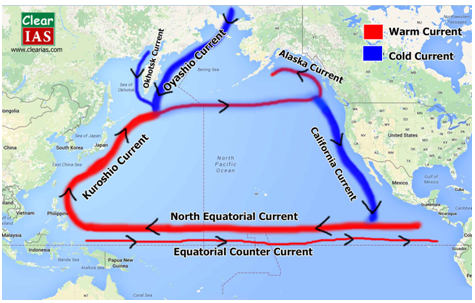 |
| 18-03-2018 17:11 | |
| Wake★★★★★ (4034) |
BarnabyJones wrote: I have to look more deeply into this: 1. This heat is NOT released entirely into the ocean. It is absorbed almost entire entirely into the surrounding rock. 2. Perhaps it eventually is released into the atmosphere through the oceans but this is over a great deal of time and at the cost of far lower temperatures on the average. You saw NO ice melting after the Takashima Earthquake. You appear to be suggesting that the present reduction (what 24% of the ice field since 1979?) would be due to that earthquake. The present volume of the Arctic ice field is about 13,000 km^3. In fact this is minuscule in comparison to Greenland and the Antarctic ice field. Greenland's ice field is some 130 times larger than this floating pile of ice and it has been melting for years. Why wouldn't the Arctic ice field? While I am in complete agreement with your numbers, which were rather violently different than the other university sources I used, and also that earthquakes carry very large amounts of energy we also know that large quakes occur only once a year somewhere on 520,000,000 miles of the surface of the earth. The ring of fire notwithstanding most of the heating is spread so thin I doubt that we can count it for much. We still must count the sheer volume of energy provided by the sun every day and not an occasional large Earthquake. And the warming trend still appears to follow the Sunspot cycles and the Milankovitch cycles pretty closely. The latest research also is pointing fingers not at just the Sun's output but the particular wavelength of the light energy released. |
| 19-03-2018 16:30 | |
| Wake★★★★★ (4034) |
Wake wrote:BarnabyJones wrote: Thought I would give you other references on energy release of earthquakes: http://www.eniscuola.net/en/argomento/subsoil/earthquakes/measuring-the-released-energy/ "To have a vague idea of the energy that is involved, it suffices to think that an earthquake of magnitude 9 has an energy of 2 x10¹⁸ joule, where the energy used every year in the entire USA amounts to 6×10¹⁹ joule!" Very large earthquakes are extremely rare. In fact anything over an 8.7 is rare. 2011 - Japan 9.1 2004 - Indian Ocean 9.1 - 9.3 1964 - Alaska 9.2 1960 - Chile 9.5 - largest ever recorded 1952 - Kamchatka USSR 9.0 Two others - one from 1800's and another from the 1700's the size of which could only be judged by damage. "Determining the Depth of an Earthquake. Earthquakes can occur anywhere between the Earth's surface and about 700 kilometers below the surface. For scientific purposes, this earthquake depth range of 0 - 700 km is divided into three zones: shallow, intermediate, and deep." The deeper the earthquake the more widely spread and slower the release of the heat energy into the surrounding ocean and atmosphere. As it turns out the strongest earthquakes are also the deepest because these are large subduction zones rather than strike-slip. Therefore these have the slowest release of energy into the surrounding unaffected zones. So I guess I'm back into the belief that earthquakes also released a great deal of energy are highly unlikely to be the cause of melting ice in the Arctic Ocean. |
| 24-03-2018 01:17 | |
| Wake★★★★★ (4034) |
Wake wrote:Wake wrote:BarnabyJones wrote: There is an article in the latest American Association for the Advancement of Science that may pertain to your ideas Barnaby: http://advances.sciencemag.org/content/4/3/eaao4915?utm_campaign=toc_advances_2018-03-23&et_rid=79437105&et_cid=1925984 |
| 24-03-2018 01:47 | |
| GreenMan★★★☆☆ (661) |
I think there is a relationship between the global average temperature, and earthquake activity. But instead of earthquakes causing it to get warmer, I think it's the other way around. As it gets warmer, we get more earthquakes, because of the weight redistribution caused by the warming. The poles lose weight/mass, and the oceans gain it. This additional weight causes shifting of the crust below, which triggers quakes. I also think that Halo Event CMEs are also responsible for triggering quakes. They warm the core, causing expansion. If that happens when a lot of weight has been redistributed, then there should be more intense quakes. So, if my guestimations are correct, we are in for a bumpy ride ahead. ~*~ GreenMan ~*~ https://www.tapatalk.com/groups/leftbehind/index.php |
| 24-03-2018 02:03 | |
Into the Night ★★★★★ ★★★★★(21597) |
GreenMan wrote: Did you know that the temperature in Seattle warmed by as much as 15 deg F already since January? And you're worried about one or two degrees of 'warming'??? It's not possible to measure the temperature of the Earth. It IS possible to monitor earthquake activity. It has not changed significantly. The Parrot Killer Debunked in my sig. - tmiddles Google keeps track of paranoid talk and i'm not on their list. I've been evaluated and certified. - keepit nuclear powered ships do not require nuclear fuel. - Swan While it is true that fossils do not burn it is also true that fossil fuels burn very well - Swan Edited on 24-03-2018 02:04 |
| 24-03-2018 19:18 | |
| Wake★★★★★ (4034) |
GreenMan wrote: While this could possibly occur the problem is that the oceans rise from about .040 inches per year to .125 inches per year is almost entirely from the melting glaciers on Greenland. And this isn't on the Ring-of-Fire which encircles the Pacific rim but instead is in the North Atlantic. A further problem is that this ocean rise is reaching it's ending since the glaciers now gather about as much snow/ice as melts off because the low levels areas have melted off and the high altitude sections attract snow. So the load of glaciers are causing some rising in the Greenland landmass. As a glacier melts at some time they become nearly transparent and melt off from both the top and the bottom And this is nearly complete. And these glacier losses show that before the Little Ice Age that this same land was farmed. Apparently people feel the need to be frightened of things returning to "normal" from 500 years ago. There is another problem. While measureing ocean's rise in the last decade or so we saw a sudden doubling of the rise. Looking into it I discovered another oddity - this sudden doubling was due to a THEORY that the mantle of the Earth shrinking as it loses heat. This means that while the ocean's rise was actually the same the added mantle shrinking doubled the ocean rise? What the hell? Barnaby was speaking of there being a great deal of added heat to the upper mantle from earthquakes. At first I doubted that because of the levels of energy I calculated from one source. But he showed another source that actually did put these at a level that could to my mind prevent any shrinking. Remember that these tectonic forces are not from the temperature losses in the inner core but from gravitic stresses and continental drift. The research is far from convincing that there is anything to fear. |
| 25-03-2018 19:36 | |
| Into the Night★★★★★ (21597) |
Wake wrote:GreenMan wrote: It is not possible to measure the sea level. You have no reference. Wake wrote: Greenland's ice isn't melting. Wake wrote: Glaciers come and go. Some are shrinking, some are expanding. No one is monitoring the world's glaciers. Wake wrote: There is no 'normal'. No one knows what the Earth's temperature 'should be'. Wake wrote: It is not possible to measure the sea level. Wake wrote: The mantle is not shrinking. Neither is the Earth (as far we we've been able to measure it). Wake wrote: What the hell is right. Wake wrote: The upper mantle is not involved in earthquakes. Earthquakes will not heat the mantle. You can't heat a hotter substance using a colder one. You can't make hot coffee with an ice cube. Wake wrote: No one is measuring the energy level of global earthquake activity. Wake wrote: The mantle is not shrinking. Neither is the Earth. Wake wrote: Continental drift occurs because of currents in the mantle below (not the core). Wake wrote: Agreed. This research is simply bogus. The Parrot Killer Debunked in my sig. - tmiddles Google keeps track of paranoid talk and i'm not on their list. I've been evaluated and certified. - keepit nuclear powered ships do not require nuclear fuel. - Swan While it is true that fossils do not burn it is also true that fossil fuels burn very well - Swan |
Join the debate Earthquakes:
Related content
| Threads | Replies | Last post |
| Why are earthquakes more likely to occur at night than during the day | 17 | 09-11-2023 12:39 |
| Magma vortex hypothesis about earthquakes | 37 | 16-08-2023 14:54 |
| Earthquakes | 6 | 15-08-2018 03:07 |
| Oklahoma Earthquakes And The Rise In Fracking | 10 | 21-12-2017 20:30 |